So far in this series, we have examined PLG as a concept, how it can be cross functionally implemented and why – when done right – it can be the right go-to-market strategy for your business. However, without a way to measure the success of your product led growth strategy, there is little to be learned and applied to your strategy moving forward. This is why establishing key short term and long term metrics and achievable KPIs is a crucial step in your PLG strategy. You are likely already tracking at least a handful of following key metrics, however establishing standard goals and benchmarks for your team to strive for when wading into the waters of PLG will provide valuable insights and allow you to make adjustments down the line to enhance your go-to-market strategy.
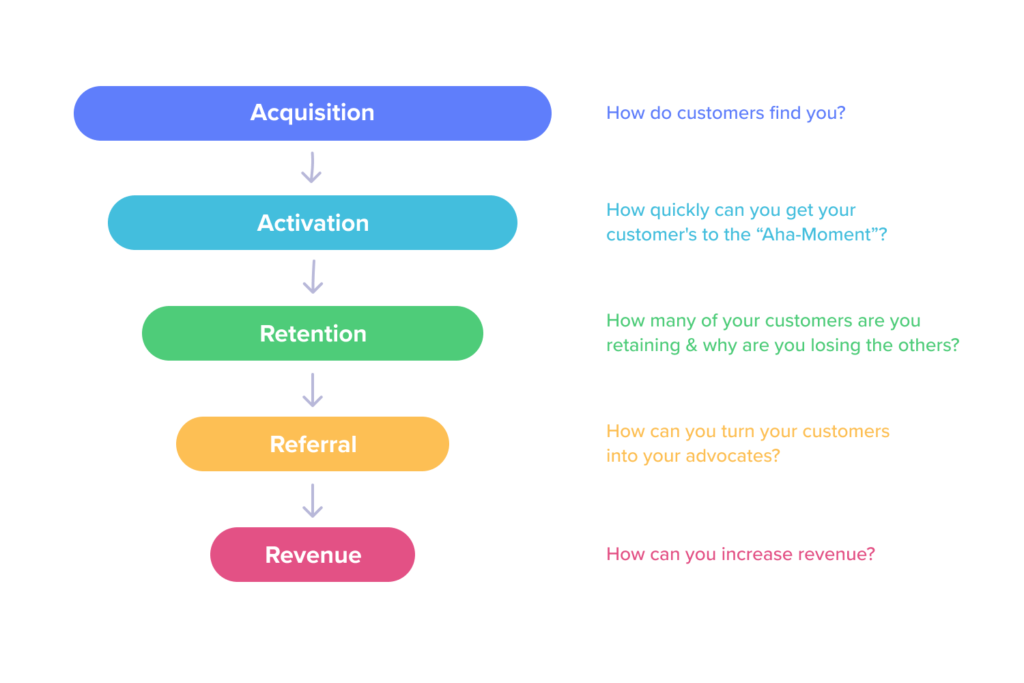
David McClure outlines the key metrics in his model known as AARRR or the term he coined, Pirate Metrics. This simple model evaluates each step in the user journey to identify any opportunities in the user lifecycle and finely hone in on where improvements need to be made.
- Acquisition: First thing’s first – you have to drive users to the product. Whether it’s an app or a website, developing a strategy to get users in front of your product through tailored channels is the first step to reaching revenue. Typically the channel strategy at this awareness stage varies by audience. For example, while it may be best to focus on social or SEO optimization for B2C audiences, B2B audiences may expect and prefer to see content marketing – also with a focus on SEO – or Event marketing at specific conferences or trade shows where they can be introduced to your brand and your product.
- Activation: Once you drive traffic to your product, the next challenge becomes making the conversion. This is where content and UX come together to drive users to take action. There are endless possibilities for how you can target even the most niche audiences – this is why collecting data through A/B testing of specific copy, design or landing pages can aid in the pursuit of a higher conversion rate.
- Revenue: there are various ways to track revenue, like average contract value (ACV), monthly recurring revenue (MRR), average revenue per user (ARPU). The revenue phase of the Pirate Model can also include upsell strategies for premium product features or add ons.
- Retention: User conversion is immediately followed by the retention phase – you want the user to continue to come back to use your product and take additional actions. Staying in touch with your users through various CRM channels and retargeting strategies can keep users engaged in the product and remind them to continue that relationship with your product. At the end of the day, in a PLG strategy, the product itself should drive retention by delivering an excellent user experience.
- Referral: Your current users can be your greatest asset in the pursuit of new users. Not only can they tell you what you need to know in terms of their behavior and interactions with the product in the user lifecycle, but they can also be a bridge to other users similar to them. Referrals from existing users can be a powerful tool particularly when there are incentives to bolster referrals.
In addition to the phases in the AARRR model, there are many other metrics that can be leveraged to evaluate your product and the user journey.
- Stickiness: The rate at which users return to the product. This helps to examine the value you are delivering by looking at how often users come back.
- Product Adoption Rate: This measures the rate at which users transition from new to recurring users. A high product adoption rate is encouraging, as it confirms that users are not only trying the product, but continuing to use it.
- Churn Rate: This is one the most important metrics to take note of when it comes to PLG – it evaluates the number of users that essentially quit your product. Keeping the churn rate as low as possible should be the utmost priority of a product led company.
- Product Qualified Leads (PQLs): A PQL is a user who has interacted with your product and taken an action indicating they will return to the product again and will continue to be a likely customer in the future. Becoming a PQL requires an action/conversion point and A/B testing can be a valuable tool in establishing the most effective strategy for those desired actions.
- Customer Lifetime Value (CLV): this refers to the expected revenue to be made on a customer and their lifetime interaction with your product
- Time to Value (TTV): The TTV is the amount of time it takes from the first interaction with your product to the moment the user is able to understand and reap the benefits of the value your product delivers. A higher TTV can result in a higher churn rate as users want to quickly get to the benefit of what you are offering.
- Expansion Revenue: Any of the revenue made from a user beyond their first purchase can be considered expansion revenue. Upselling your users on additional premium features is a way to grow your expansion revenue. While growing your user base is crucial, your existing customers are a massive opportunity when it comes to cross selling and upselling products.
Product led growth relies on the intrinsic value that your product delivers to its users and an effective GTM plan to make sure it is put in front of the right audiences. Even the best products require some strategic thinking when it comes to driving users down the funnel to take action at that conversion point. Having the ability to evaluate and track users in their interaction and lifecycle with your product is essential for a successful launch and a successful future. Being armed with insights through these powerful metrics will help to fine tune the user experience and enhance revenue generation down the line. Learn more about how Bluetext can support and track your PLG strategy.