In a digital-first world, the difference between growth and stagnation often comes down to how clearly and quickly your ads communicate value. Buyers skim, compare, and shortlist before they ever speak to sales. That is why B2B ad design experts are now central to marketing performance. They combine brand strategy, data, and channel-specific creative to stop the scroll, earn attention, and convert qualified demand. For executive marketers managing complex portfolios, government audiences, or high-stakes categories, expert ad design is no longer an optional capability. It is the connective tissue between positioning, pipeline, and revenue.
Why Creative Is the New Performance Multiplier in B2B
As performance channels mature, the media edge narrows. Targeting looks similar across competitors. Budgets face constant scrutiny. In this environment, creative quality has become the largest variable that teams can control. B2B ad design experts maximize that variable. They build ideas and visual systems that clarify the offer, resolve buyer uncertainty, and accelerate action across the funnel. Strong creative can lift click-through and conversion rates even when the audience and bids remain unchanged. Better still, it compounds. Once a winning concept is identified, variants extend performance across formats and segments without diluting message clarity.
Executives often ask if brand and demand are in conflict. B2B ad design experts align them. They use brand assets as performance levers and ensure that the first impression of your company is consistent from display to landing page to sales follow up. This coherence reduces friction for buyers and raises marginal ROI on every subsequent impression.

Explore how we deployed our full creative suite for CBIZ
What Do B2B Ad Design Experts Actually Do?
These specialists operate at the intersection of creative strategy and modern media. Their work spans research, ideation, design, testing, and optimization, all tuned to B2B and B2G realities. Typical responsibilities include:
- Translating complex value propositions into simple, high-contrast creative that can be understood in two seconds.
- Designing channel-native assets for LinkedIn, programmatic display, paid social, CTV, and ABM activation.
- Developing modular ad systems with reusable elements, so campaigns can scale without sacrificing quality.
- Running structured creative tests and folding the results back into concept development.
- Partnering with demand generation and sales to ensure creative aligns with ICPs, offers, and pipeline goals.
B2B ad design experts also understand the nuance of selling into regulated industries and the public sector. They design within compliance constraints while preserving stopping power, which is especially critical in categories like cybersecurity, aerospace, healthcare, and government technology.
How Experts Turn Complex Offers Into Clear, High-Impact Ads
Many B2B and B2G products are technical and multi-layered. The temptation is to jam too much into the ad. B2B ad design experts do the opposite. They reduce the message to a single promise and a single action. They prioritize the most credible proof point. They select imagery that expresses outcomes rather than features. The goal is pre-qualification at speed. If the viewer is the right buyer, the ad should create instant relevance and invite a next step. If not, it should politely filter out the rest.
They also map creative to buying stage. Early-funnel units raise a problem or open a curiosity gap. Mid-funnel assets frame a choice and show contrast with competitors. Late-stage ads reinforce urgency and use social proof or risk mitigation to help buyers finalize.
Channel-Specific Design Principles That Raise Response
One-size-fits-all creative is an expensive myth. B2B ad design experts treat each channel as a different medium with different grammar.
- LinkedIn: Design for professional scanning patterns. Use bold value statements, a visible brand mark, and copy blocks that read well on mobile. Incorporate dynamic offers like webinars or reports to drive lead capture with minimal friction.
- Programmatic Display: Maximize legibility at small sizes. Focus on high-contrast color, short copy, and a repeatable headline structure so sequential frames tell a clear story.
- Connected TV: Lead with brand and problem framing in the first three seconds. Use supers and simple visuals to accommodate sound-off viewing. Close with a memorable line and URL.
- ABM: Personalization is more than a name. Tailor creative to the account’s current initiative or tech stack. Build variant sets that speak to roles within buying committees.
- Paid Social: Design for movement. Subtle animations and micro-interactions increase thumb-stopping power, but only when they reinforce the message rather than distract.
To see how ideas translate into breakthrough campaigns, review our advertising work for advanced B2B and public sector brands.
Why Motion, Sound, and 3D Matter More Than Ever
Static images still play a role, but the attention economy increasingly rewards motion and sound. B2B ad design experts integrate lightweight animations and short-form video to deliver more meaning in less time. A quick parallax effect can dramatize a transformation. A sonic logo can make an impression before a viewer looks up. 3D elements can explain a system architecture within seconds. The key is not flair for its own sake. Motion earns its place when it clarifies the value proposition or accelerates comprehension, especially in technology and industrial categories.
Creative Testing That Actually Produces Answers
Testing without a hypothesis wastes spend. B2B ad design experts plan experiments around a creative ladder. They test big things first, like core message or visual metaphor, before refining smaller elements. They also protect test integrity with even budget allocation and consistent audience definitions. Once a winner emerges, they scale it across channels with channel-specific adaptations, rather than simply resizing a single file. This approach builds cumulative learning, so every campaign starts smarter than the last.
Data Signals That Guide Continuous Improvement
Executives need to know which creative decisions are driving returns. B2B ad design experts create a feedback loop that connects creative variables to performance metrics. They tag assets by concept, offer, and design choice. They pair CTR and engagement with lead quality and pipeline contribution. They compare scroll depth and dwell time on the landing page to isolate friction. Over time, patterns emerge. Certain metaphors resonate with CISOs. Certain proof points move operations leaders. This pattern recognition shapes the next campaign brief and speeds the path to scale.

Inside our comprehensive creative approach for Intelsat’s website redesign
Accessibility, Compliance, and Brand Safety in B2G Environments
Public sector advertising introduces additional requirements. Accessibility standards like color contrast and readable type sizes are non-negotiable. Claims must be accurate and defensible. Media placements must align with brand safety thresholds. B2B ad design experts bake these constraints into creative templates and review workflows so campaigns stay compliant without losing impact. For organizations targeting federal, state, and local buyers, expert alignment with procurement cycles and policy language is an advantage, not a barrier. Explore our public sector work to see how creative excellence and compliance can co-exist.
Integrating Creative and Demand Generation for Pipeline Growth
Isolated creative wins rarely translate into revenue. B2B ad design experts collaborate tightly with demand generation to align ICP definitions, content strategy, and lead capture flows. They design ad units as part of a system that includes landing page modules, interactive tools, and nurture sequences. They ensure continuity of message so prospects never feel a disconnect between the ad they clicked and the page they land on. This integration increases conversion rates and reduces cost per opportunity.
When growth targets depend on sustained performance, it helps to have partners that have built programs end-to-end. See our approach to demand and lead generation to understand how creative and pipeline work together.
Creative Architecture for Enterprise and Portfolio Brands
Many enterprise marketers manage multiple products, regions, or sub-brands. B2B ad design experts architect creative systems that scale. They establish a hierarchy of messaging so that corporate brand, solution category, and product-level claims do not collide. They define flexible templates that local teams can adapt without diluting core identity. They build asset libraries with modular blocks, which reduces production time and helps media teams move faster when market conditions change.
Measurement That Proves the Value of Better Design
Leaders do not just want incremental metrics. They want to see the contribution to sales cycles and bookings. B2B ad design experts capture both top-of-funnel and down-funnel impact. They benchmark creative lift against prior campaigns. They measure the velocity of opportunities touched by the campaign. They attribute content downloads and webinar registrations to specific creative concepts. They look at multi-touch paths to understand when and where creative moved a buyer closer to a decision. With this level of clarity, it is easier to justify increased investment in the ideas that are moving markets.
How to Choose the Right B2B Ad Design Experts
Not all creative partners are built for complex B2B and B2G needs. As you evaluate options, look for:
- Evidence of results in your category and buyer audience.
- Demonstrated collaboration between creative and performance teams.
- Comfort with compliance, accessibility, and security requirements.
- Ability to scale concepts across formats, languages, and regions.
- A rigorous testing methodology with clear documentation.
Ask to see concept boards, testing frameworks, and post-mortem analyses. Review channel-native work, not just brand campaigns. Confirm that the team can handle both the vision and the velocity required by modern media calendars.

Walk through how our full funnel video campaign for nShift helped grow their pipeline
The Rising Role of AI in Ad Design, Without Losing the Human Edge
Generative tools can accelerate storyboard drafts, image exploration, and copy variants. B2B ad design experts use AI as a creative co-pilot while maintaining human judgment on narrative, taste, and brand fit. They also set governance norms to protect IP and ensure ethical data use. The best results occur when AI expands the option space early in concepting and when experts decide which ideas deserve investment, polish, and testing.
Avoiding Common Pitfalls That Kill Performance
Even strong teams fall into traps that blunt results. B2B ad design experts help you avoid:
- Feature overload: Ads try to explain everything and end up convincing no one.
- Visual noise: Fancy effects make the ad look impressive but slow comprehension.
- Copy bloat: Long subheads that wrap on mobile and reduce click clarity.
- Landing page mismatch: The page fails to deliver the promise of the ad.
- Testing drift: Simultaneous changes to too many variables obscure learnings.
By standardizing creative briefs, concept reviews, and QA protocols, expert teams keep campaigns aligned and outcomes predictable.
From Messaging to Market Momentum
Great ads do more than drive clicks. They shift how your market talks about a category. B2B ad design experts craft narratives that position your company as an authority and simplify key distinctions. Over the course of a quarter, the right concept library can redefine the choice set for buyers, influence peer conversations, and set up sales with stronger inbound intent. Creative becomes a strategy instrument, not just a production task.
Why Bluetext for Executive-Grade Creative and Performance
Bluetext brings senior strategic leadership together with hands-on creative execution for organizations that expect measurable growth. As a full-service B2B marketing agency, we align brand, messaging, media, and analytics so each campaign builds on the last. Our B2B ad design experts create work that is crisp, compliant, and conversion minded across enterprise technology, cybersecurity, industrial, healthcare, and government sectors. We design to win attention and to win deals.
A Practical Framework to Launch Your Next Campaign
If you need to move quickly, use this simple framework. It reflects how B2B ad design experts approach high-stakes campaigns:
- Define a single buyer action per campaign and a single promise that leads to it.
- Craft three distinct creative concepts that express the promise through different metaphors.
- Design channel-native variants for two priority media placements to start.
- Launch a controlled A/B test that isolates the concept as the primary variable.
- Scale the winner across additional formats with tailored adaptations, not simple resizes.
- Refresh the concept with motion and copy variants at week three to counter fatigue.
- Roll learnings into the next campaign brief and repeat the cycle.
This approach keeps teams focused on decisions that matter and compresses time to insight. It also produces a growing library of proven creative that can be repurposed for events, sales enablement, and product launches.
Bring Your Story to Life With Expert Ad Design
Digital-first buyers move fast and reward clarity. The brands that rise above the noise will be those that invest in expert creative and connect it to performance with discipline. B2B ad design experts deliver that edge. They turn strategy into market momentum, translate complexity into compelling narratives, and meet buyers with the right message in the right format at the right time. If your vision for growth requires both breakthrough ideas and measurable outcomes, Bluetext is ready to help. Explore our integrated capabilities, see how we build campaigns that convert, and connect with our team to put expert creative to work for your pipeline. Contact us to get started on a strategy, branding, or campaign program built for a digital-first world.
Marketing leaders face constant pressure to turn budgets into predictable pipeline. That is why data-driven planning sits at the core of modern B2B and B2G growth. When every channel, message, and touchpoint is instrumented for insight, teams can prioritize the programs that accelerate revenue and sunset what does not. The most effective B2B marketing campaign strategies blend rigorous analytics, pragmatic experimentation, and tight alignment with sales operations. This article outlines how to architect that engine, which metrics to track, and how to iterate toward better ROI without adding unnecessary complexity.
Build a reliable data foundation that decisions can trust
Every strong program begins with dependable data. Without clean pipelines and consistent taxonomy, even the smartest B2B marketing campaign strategies degrade into guesswork. Start with first-party data quality inside your CRM and MAP. Standardize account hierarchies, buying roles, and fields for industry, size, and technology stack. Enforce UTM governance for all paid and owned media. Connect site analytics, ad platforms, and offline events to a common identity graph. A lightweight customer data model enables accurate attribution and clearer cohort analysis across the full funnel.
Leaders often unlock value quickly by consolidating reporting through a single source of truth. That can be as simple as a data warehouse and a standardized dashboard that maps impressions and clicks to MQL, SQL, pipeline, and revenue. Robust tagging frameworks and server-side tracking reduce signal loss, while privacy controls protect consented users. If your team needs help designing the measurement corpus, Bluetext’s research and analytics capabilities can establish the instrumentation and taxonomy that futureproof decision making. With that base layer in place, B2B marketing campaign strategies can run faster and scale with confidence.

Define the KPIs that matter to revenue, not vanity metrics
Executives do not invest in clicks or impressions. They invest in pipeline conversions, deal velocity, and revenue predictability. Align on a concise KPI set that ladders to commercial outcomes and reflects the stages you can influence. For B2B marketing campaign strategies, that typically includes cost per high-quality MQL, conversion rate to SAL, SQL acceptance rate, opportunity win rate, and CAC payback. Add channel-level ROAS and lead-to-opportunity cycle time to spot where friction lives. Make each metric time bound and segmentable by audience, product, and region to enable root-cause analysis.
Standardize your definitions and source of truth
Teams drift when MQL, SAL, and SQL mean different things across regions or products. Lock definitions with sales leadership and marketing ops, document them, and enforce them through automation. Decide how to handle multi-threaded accounts, SDR-sourced leads, and partner influence. When everyone shares the same scorecard, B2B marketing campaign strategies can be compared objectively and optimized with far less debate.
Segment smarter with ICPs, buying committees, and intent
High-ROI programs start with a precise Ideal Customer Profile and clear buying committee maps. Blend firmographic, technographic, and behavioral signals to prioritize accounts that look like your top cohorts. Layer third-party intent data to detect in-market momentum. The goal is fewer, better, targets with higher propensity to buy. In practice, this is where many B2B marketing campaign strategies unlock step-change efficiency because outreach focuses on accounts with existing need and authority.
Operationalize ICPs in your stack
ICPs only drive value when they power segmentation inside your platforms. Build audiences in your MAP and ad tools using consistent attributes and scoring thresholds. Align content and offers to each buying role and funnel stage. Map keywords and creative to use cases rather than product features. With a shared audience spine, B2B marketing campaign strategies deliver more relevant experiences and lift conversion rates across channels.
Watch the nShift brand come to life
Calibrate your channel mix with experiments that prove causality
Optimized channel allocation is not a one-time decision. It is a continuous test-and-learn process that weighs reach, intent, and cost dynamics. Start with a performance baseline for paid search, paid social, programmatic, content syndication, and events. Then run clean experiments to understand incrementality. Holdout tests, geo splits, and matched-market designs reveal what is truly additive. The strongest B2B marketing campaign strategies invest where marginal dollars produce new qualified demand rather than cannibalized conversions.
- Paid Search: Capture active demand and protect brand terms with efficient bidding and negative keyword hygiene.
- Paid Social: Use LinkedIn and industry networks for matched audience ABM and mid-funnel education.
- Programmatic: Scale reach to ICP accounts using firmographic targeting and frequency caps that respect user experience.
- Content Syndication: Contract for quality controls, verify leads against ICP, and enforce strict data rights.
- Events and Webinars: Score engaged attendees differently and orchestrate fast, relevant sales follow up.
Treat SEO as a compounding demand engine
Search is often the most capital-efficient channel over time. Technical hygiene and authoritative content compound into sustained visibility. Build topic clusters around your customers’ problems, not your product catalog. Align content with buyer stages and integrate strong internal linking. Align keyword intent to offers that progress the conversation. See how Bluetext approaches search engine optimization to make organic growth a predictable contributor to pipeline, and fold those learnings into your broader B2B marketing campaign strategies.
Creative and message testing that lowers Customer Acquisition Cost
Media buying finds the audience. Creative earns the response. Treat message and offer testing as a quarterly discipline, not an ad-hoc exercise. Develop hypotheses by persona and stage, then test at the concept level before iterating tactics. Rotate new value propositions, social proof, and proof-of-outcome narratives. Shorten forms and experiment with progressive profiling. The right creative system improves resonance across B2B marketing campaign strategies and directly reduces cost per qualified lead.
Personalize responsibly at scale
Personalization should clarify value, not feel intrusive. Use dynamic creative, modular landing pages, and tailored CTAs that reflect industry and role. Personalize the experience for accounts in active cycles while maintaining respect for privacy choices. A disciplined approach to website personalization can lift engagement without risking trust. When these techniques support buyer progress, they become a force multiplier for b2b marketing campaign strategies that must perform across long, complex cycles.
Full-funnel attribution that sales leadership trusts
Attribution is a means to better decisions, not an end in itself. Use a hybrid approach that blends multi-touch models with incrementality testing to cross-check conclusions. Report at the account level wherever possible, since buying happens collectively. Attribute influence to channels that created net-new engagement within target accounts, while crediting last-touch conversions fairly. Transparently communicate model limitations. With this balanced view, B2B marketing campaign strategies can be funded based on demonstrated contribution to opportunity creation and progression.
ABM measurement essentials
Executives want to know if account-based investments are winning the right conversations. Track account coverage, reach into the buying committee, meeting creation, stage progression, and deal size uplift for targeted cohorts versus controls. Add qualitative signals like executive alignment and use case clarity. By framing success at the account level, B2B marketing campaign strategies gain credibility and shield high-value programs from short-term cuts.
Budget allocation and scenario planning for resilient growth
Budgets should shift in response to evidence. Build quarterly scenario models that project pipeline and revenue given changes in spend, conversion rates, and cycle time. Set thresholds for reallocation, such as minimum expected ROAS or CAC payback limits. Score opportunities by upside, risk, and time-to-impact. This discipline helps B2B marketing campaign strategies ride out macro volatility while maintaining momentum in the channels that compound.
Governance, privacy, and data ethics as competitive advantage
Trust sits at the center of enterprise buying. Treat privacy and consent as design requirements, not compliance checkboxes. Maintain data minimization practices and clear retention rules. Deploy server-side tagging and robust consent management to reduce signal loss while honoring user choices. Document data flows and access policies, then review them quarterly. Responsible data practices reduce legal exposure and reinforce brand credibility, which supports B2B marketing campaign strategies that depend on multi-threaded engagement across long cycles.

Dig deeper into our work with FireEye
A 90-day plan to operationalize data-driven ROI
Turning vision into action requires a disciplined, time-bound plan. Here is a pragmatic sequence to move from strategy to impact in three months while setting the stage for long-term gains. Each step strengthens your operating system and accelerates the performance of current B2B marketing campaign strategies.
- Weeks 1 to 2: Align on definitions and KPIs. Finalize ICP and buying committee maps. Audit tracking, UTMs, and consent status. Establish a single reporting dashboard for funnel and pipeline metrics.
- Weeks 3 to 4: Clean critical CRM fields, dedupe high-value accounts, and enrich with technographic and intent data. Establish channel baselines with current ROAS and conversion rates.
- Weeks 5 to 6: Launch two controlled experiments in your largest channels. Example: incrementality test on paid search non-brand and a geo split on LinkedIn ABM. Document hypotheses, success criteria, and sample sizes.
- Weeks 7 to 8: Stand up a creative testing program with three concept variants per key persona. Refresh landing pages with modular components and clear offer-paths. Tighten SDR follow-up sequences to reflect buyer role.
- Weeks 9 to 10: Deploy an organic content sprint aligned to top problem themes and buyer stages. Connect it to your demand and lead generation plays with contextual CTAs and progressive profiling.
- Weeks 11 to 12: Review experiment results, reallocate 15 to 20 percent of budget to proven winners, and update your scenario model. Summarize learnings for sales leadership with clear recommendations for the next quarter’s B2B marketing campaign strategies.
If this plan sounds heavy for current staffing, consider partnering with a B2B marketing agency that can augment in-house teams with specialized strategy, creative, and analytics resources. A partner accelerates implementation and brings independent rigor to measurement, which sharpens B2B marketing campaign strategies and compresses time to value.
How Bluetext helps teams move from insight to impact
Data alone does not produce growth. Impact happens when the right strategy meets disciplined execution and compelling creative. Bluetext brings proven expertise across research, positioning, visual identity, content systems, media planning, and analytics. Our teams align stakeholders around a clear growth thesis, then ship the assets and orchestration that operationalize it. Whether you need a new narrative, a modular website, a performance media overhaul, or advanced measurement, we build programs designed to lift ROI and give executives confidence in their B2B marketing campaign strategies.
Clients lean on Bluetext to stand up clean measurement frameworks, run structured experimentation, and convert findings into playbooks their teams can scale. From ABM orchestration to content engines and performance media, we design and optimize the components that turn strategy into predictable pipeline. If you want the clarity and confidence that come with a data-driven system, and you are ready to operationalize smarter B2B marketing campaign strategies, our team can help.
Key takeaways for executive leaders
To summarize the programmatic shifts that matter most for ROI, keep these principles top of mind as you evolve your B2B marketing campaign strategies.
- Invest first in the data foundation and shared definitions that enable credible decisions.
- Design KPIs around pipeline, velocity, and revenue, not surface-level engagement metrics.
- Focus segmentation on ICPs and active intent, then reflect that in channel targeting and creative.
- Prove channel contribution with incrementality tests, and let results reallocate budget.
- Operationalize creative testing and responsible personalization to raise conversion rates.
- Use hybrid attribution with account-level views to earn sales leadership trust.
- Guard privacy and ethics to strengthen brand trust across long enterprise cycles.
Each principle compounds in value when executed together. The result is a system where data clarifies direction, experiments reduce risk, and investment flows to what works. That is the cadence behind the highest performing B2B marketing campaign strategies, and it is achievable with pragmatic planning and the right expertise.
Next step
If you are ready to transform how your organization plans, measures, and optimizes for growth, connect with a partner who has done it across industries and the public sector. Explore how Bluetext strengthens analytics, messaging, and performance media to elevate ROI, then contact Bluetext to discuss your goals and build a roadmap for data-driven B2B marketing campaign strategies that deliver measurable pipeline and revenue impact.
Digital transformation is no longer a technology project. It is an operating mandate for growth-minded CMOs and CROs. As buying journeys fragment across channels and stakeholders, the winners will be those who modernize data, tools, and processes to deliver outcomes at scale. In this environment, b2b marketing campaign strategies are the connective tissue between vision and revenue. They translate transformation into pipeline, accelerate sales velocity, and create measurable customer value. This post outlines how leaders can navigate the complexity with clear priorities, pragmatic frameworks, and a roadmap to ROI.
What digital transformation means for B2B marketers today
For marketing leaders, digital transformation spans more than a new martech platform or a redesigned website. It is the disciplined integration of data, technology, content, and talent that improves speed to market and precision. It creates the foundation for personalization, analytics-driven decisions, and cross-functional collaboration with sales, product, and finance. Most importantly, it elevates b2b marketing campaign strategies from isolated tactics to orchestrated programs that move markets.
Three shifts define the moment. First, first-party data is now the strategic asset, requiring consent frameworks, robust governance, and interoperable systems. Second, AI augments teams with faster insights and creative acceleration, provided guardrails and QA are in place. Third, buying committees expect consumer-grade experiences, which demands frictionless digital journeys and consistent brand narratives at every touchpoint.
How to modernize your marketing operating model
Technology does not fix a broken operating model. Start by aligning people and processes to outcomes. Build cross-functional pods around target segments or solutions. Pair marketing operations, content, performance, and sales counterparts in agile sprints with clearly defined SLAs. Establish a revenue operations cadence that prioritizes pipeline coverage, stage conversions, and lagging velocity, not vanity metrics.
Codify decision rights. Your governance model should specify who sets audience strategy, who owns data standards, and who can approve changes to campaigns and budgets. This clarity reduces cycle time and allows b2b marketing campaign strategies to move from planning to launch in days, not months.

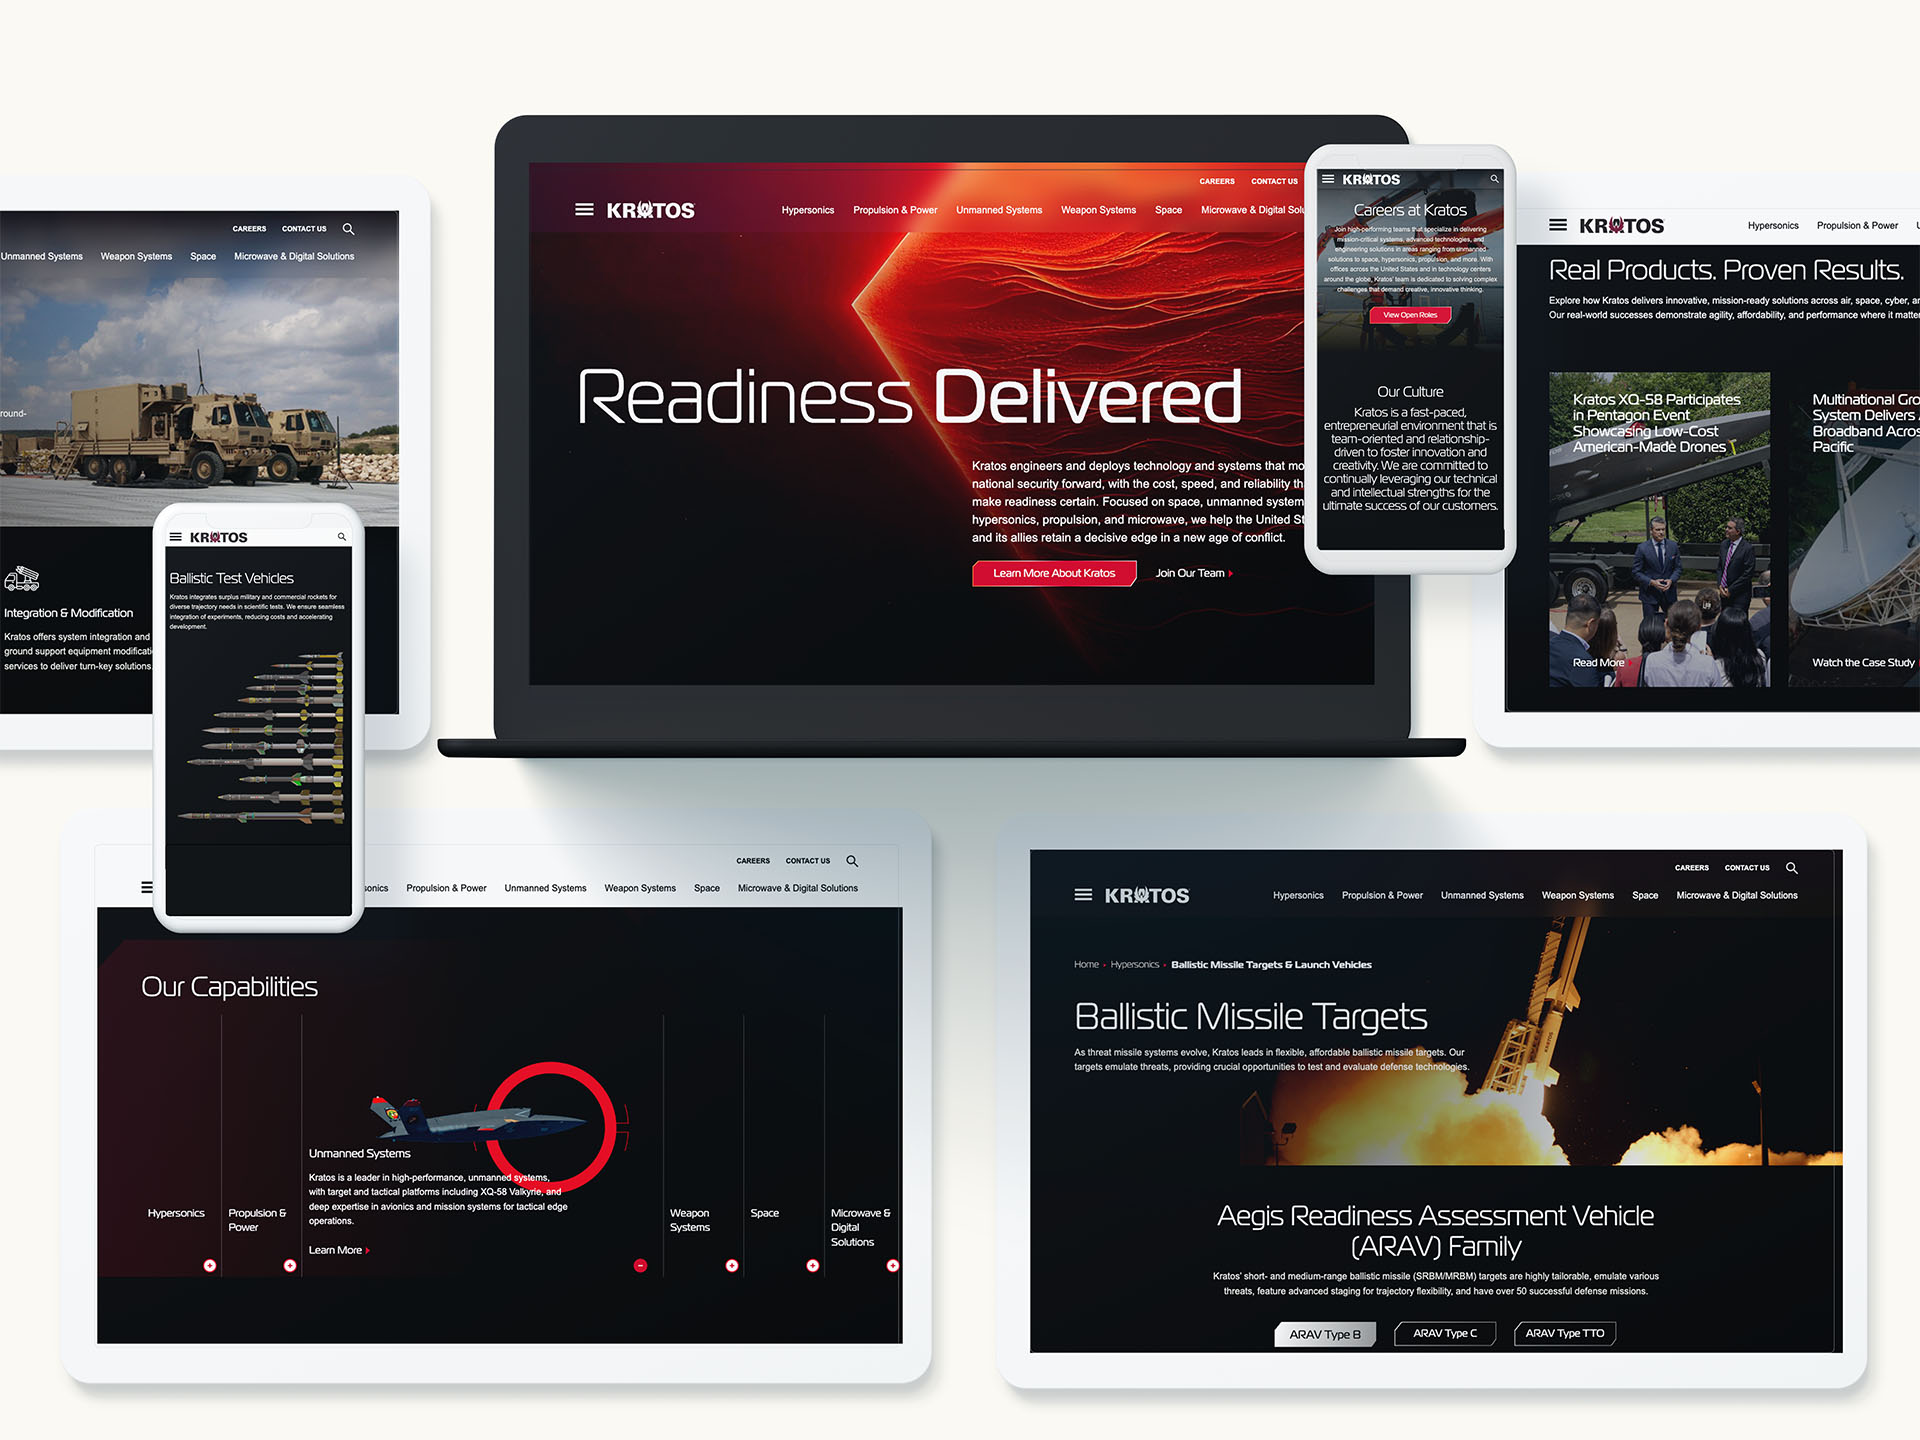
Pull back the curtain on our work with Kratos
Building a future-ready martech stack
A resilient stack is modular, integrated, and focused on the use cases that matter. Many organizations carry overlapping tools and underused features. Define the business questions first, such as which audiences to prioritize, what journey friction exists, and how to allocate spend. Then map capabilities across CRM, MAP, CDP, CMS, analytics, and collaboration layers. Integrations should serve data unification, identity resolution, lead routing, and content activation, not tool accumulation.
Prioritize capabilities that immediately improve buyer experience. For example, website personalization can increase relevance across industries, roles, and account tiers without waiting for a full CDP rollout. Connect that experience to your MAP for triggered nurture and to your CRM for sales context. Align taxonomy across platforms to simplify reporting and experimentation.
Practical checklist to rationalize tools
- Inventory every platform by owner, cost, contract term, and key features actually in use.
- Define no more than five core use cases per quarter that the stack must enable.
- Consolidate overlapping functionality to reduce cost and cognitive load on teams.
- Implement standardized UTM, naming conventions, and audience schemas across channels.
- Automate governance tasks like permissioning, lead deduplication, and enrichment.
Data strategy that powers precision and privacy
Data is the engine of transformation, but only when it is accurate, consented, and actionable. Establish a single definition of the customer that links accounts, contacts, and opportunities. Use progressive profiling to capture missing attributes while minimizing form friction. Apply validation on intake to protect quality, and schedule regular hygiene to reduce decay. Define how signals like content engagement, intent data, and product usage scores combine to qualify opportunities.
Privacy is a brand advantage. Treat consent, retention rules, and data minimization as core brand promises. Document data lineage and access policies, especially in complex B2G environments. When data confidence is high, b2b marketing campaign strategies can target precisely, measure cleanly, and scale globally without rework.
AI in b2b marketing campaign strategies: where it adds real value
AI helps teams work smarter across the lifecycle when applied with discipline. Use it to synthesize market research and identify whitespace. Speed content development with on-brief ideation, modular copy generation, and metadata optimization, followed by human editing and governance. Improve media performance with predictive audiences and budget allocation that responds to real-time signals. Deploy AI for QA on tagging, broken links, and accessibility compliance to protect experience quality.
Establish guardrails. Maintain a human-in-the-loop for brand voice, claims, and regulated content. Keep training data clean and permissioned. Track model outputs with the same rigor you apply to campaign reporting. When AI augments skilled practitioners, it enables b2b marketing campaign strategies to reach market faster and learn at scale.
From ABM to ABX: orchestrating the full journey
Account-based marketing is evolving into account-based experiences. Start with a tight ICP and a signals strategy across intent, technographics, and relationship strength. Coordinate outbound, paid media, and content syndication to open doors, while product trials, analyst proof, and executive briefings progress deals. Align sales and marketing around joint plays with clear entry and exit criteria. Document the full customer lifecycle from acquisition to expansion so that programs serve renewal and advocacy, not just net-new.
Translate these design choices into b2b marketing campaign strategies with channel-specific plays. For example, a tier-one program might blend executive events, custom content, and 1:1 ads, while a tier-three cohort receives industry-specific nurture and retargeting. Unify creative and offers so that every touch reinforces the same value story and next step.
Tiered programs that scale
- Tier one: bespoke content, leadership outreach, solution workshops, and customer references.
- Tier two: dynamic web experiences, role-based nurture, and coordinated SDR sequences.
- Tier three: programmatic display, partner co-marketing, and curated thought leadership.
See how we helped CACI transform
Creative and content as transformation catalysts
Transformation succeeds when your story is clear and compelling. A differentiated narrative turns features into outcomes and enables sales to sell higher and faster. Invest in a modular content system that reuses core assets across formats and funnel stages. Thought leadership should frame a problem space, quantify business impact, and offer a practical path forward. Align content to journey stages, from problem identification to solution selection, with explicit calls to action that advance momentum.
For executional excellence, collaborate with specialists in content marketing who can connect brand, narrative, and channel activation. Pair strong visuals with crisp messaging, and test variations against priority segments. Creativity and consistency are force multipliers that make b2b marketing campaign strategies memorable and trusted.
Paid, owned, and earned media working as one
Channel choice matters less than orchestration. Blend search, social, display, and events around the same audience hypothesis and offer strategy. Use paid to generate qualified attention, owned to deepen engagement, and earned to accelerate trust. Maintain message discipline across placements so that repetition builds meaning. Implement testing frameworks that compare offers, creative, and landing experiences by segment and buying stage.
Optimize discoverability. Technical and on-page search engine optimization strengthens your owned foundation, lowers cost per acquisition, and compounds results over time. Map content to high-intent queries that align with your solutions. A strong organic base turns b2b marketing campaign strategies into durable growth engines beyond paid spikes.
Measurement framework executives can run
- Business outcomes: pipeline contribution, revenue, average deal size, and win rate.
- Leading indicators: engagement depth, sales acceptance rate, and stage-by-stage conversion.
- Channel metrics: CAC and payback by program, informed by clear attribution rules.
- Cadence: weekly operational dashboards, monthly optimization reviews, and quarterly strategy resets.
Governance, security, and compliance for B2G realities
Public sector and regulated markets introduce additional requirements for content claims, data handling, and procurement processes. Build compliance reviews into creative and media workflows. Segment workspaces and permissions to isolate sensitive data. Maintain documentation that accelerates due diligence when partnering with agencies or vendors. For organizations selling to government buyers, partner with a public sector digital marketing agency that understands procurement cycles, mission priorities, and stakeholder dynamics. These capabilities strengthen b2b marketing campaign strategies in complex stakeholder environments.

View how we brought the BlueHalo branding from an idea to reality
Seven moves to accelerate value in the next 90 days
- Audit and align. Run a rapid maturity assessment across data, tech, content, and measurement. Choose three use cases that will materially improve b2b marketing campaign strategies this quarter.
- Rebuild the dashboard. Replace channel-first views with revenue-centric KPIs. Make it easy to see how b2b marketing campaign strategies affect pipeline, velocity, and expansion.
- Tighten the ICP. Use sales feedback, intent signals, and win-loss insights to refine target accounts. Focus b2b marketing campaign strategies on segments with the highest propensity to buy.
- Speed the website. Fix performance, accessibility, and journey friction. Launch high-impact experiments that support b2b marketing campaign strategies, like simplified forms and contextual offers.
- Unify naming conventions. Harmonize UTMs, campaigns, and audience taxonomies. This single step improves reporting fidelity and the agility of b2b marketing campaign strategies.
- Activate AI responsibly. Pilot AI for content variation, QA, and budget pacing with human oversight. Measure lift to validate inclusion in future b2b marketing campaign strategies.
- Strengthen sales alignment. Align SLAs, messaging, and follow-up plays. Jointly review accounts weekly to refine b2b marketing campaign strategies based on real buyer signals.
Invest in analytics and intelligence for confident decisions
Transformation stalls without credible insight. Establish a data layer that captures anonymous and known behaviors, enriches profiles, and supports predictive scoring. Standardize models for lead and account qualification so that sales trusts what marketing delivers. Implement test-and-learn plans with clear hypotheses and success thresholds. Equip teams with scenario planning tools to reallocate spend in response to market shifts.
When teams can see signal early and measure impact clearly, they improve b2b marketing campaign strategies with confidence. Consider partnering on advanced attribution, forecasting, and optimization through specialized marketing analytics technology implementations that fit your stack and budget.
Why Bluetext is a proven partner for digital transformation
Digital transformation succeeds when strategy, creativity, and execution stay aligned to revenue outcomes. Bluetext brings integrated capabilities across brand, content, media, and technology to help leaders modernize faster. As a specialized B2B marketing agency, we design b2b marketing campaign strategies that connect narrative, data, and channels into performance systems. We solve for the near-term wins that build momentum, while laying the long-term foundation for durable growth.
Our teams operationalize insights into action, from segment strategy to agile production and optimization. We activate modular content across paid, owned, and earned, and we embed measurement frameworks that fund what works. We also remove friction across martech and workflows, using proven playbooks and accelerators. If you need help turning digital transformation goals into b2b marketing campaign strategies that deliver pipeline and revenue, explore how our specialists in website personalization and content marketing support faster time to value.
Now is the time to simplify, focus, and scale what works. If you are ready to sharpen your vision, modernize your stack, and build b2b marketing campaign strategies that move the market, contact Bluetext to discuss your goals and opportunities.
Marketing leaders in complex B2B and B2G categories are navigating longer buying cycles, stricter compliance environments, and higher expectations for digital experiences. The firms winning market share are not just executing more campaigns. They are reimagining engagement with the rigor of product design and the precision of revenue operations. Creative digital marketing agencies bring that blend of creativity and accountability to the table, translating strategy into experiences that move buying groups from interest to intent to purchase. This article outlines the innovative strategies these partners deploy and how modern brands can put them to work now.
Why B2B and B2G leaders are turning to specialized partners
Most enterprise teams have the talent to run programs. What is missing is the cross-functional orchestration that ties brand, content, media, and sales motions together. Creative digital marketing agencies fill that gap with integrated teams across strategy, design, technology, and analytics. For executives who need outcomes instead of activities, this model compresses time to value and creates accountability from brief to board deck.
The most effective partners operate like growth architects. They assess markets, clarify positioning, design measurement frameworks, and ship experiments that scale when they work and sunset when they do not. That approach is why many organizations select a B2B marketing agency as a force multiplier for in-house resources, especially when entering new verticals or consolidating portfolios after M&A. In parallel, public sector vendors often require the nuanced understanding that only seasoned B2G teams can provide.
From disconnected campaigns to connected experiences
Campaigns remain useful, but they should sit inside a larger experience architecture that anticipates each interaction in the buying journey. Creative digital marketing agencies map that architecture across owned, earned, and paid environments. The goal is not just to serve more impressions, but to choreograph a sequence of helpful interactions that reduce friction and build preference.
Three principles define this shift. First, design for buying groups, not personas in isolation, because consensus buying dominates complex purchases. Second, replace sporadic handoffs with automated signal sharing across platforms so intent data from one touchpoint improves the next. Third, keep brand consistency while tailoring message depth by role so champions, influencers, and approvers each see value framed in their language.
From ABM 1.0 to buying group design
Account-based marketing once meant firmographic targeting with broad messaging. Creative digital marketing agencies now structure buying group design at the outset. They identify decision makers, map information needs by stage, and align content to expected objections. The result is less waste and more velocity. When a technical evaluator engages, the next touch offers detail. When a budget holder responds, the next step sharpens business outcomes and risk mitigation.
Data, privacy, and precision audience strategy
Precision targeting and privacy can coexist. The best creative digital marketing agencies operate with governance-first data practices while still unlocking competitive advantage through analytics. They prioritize first-party signals, build consented data models, and reduce dependency on rented audiences that can vanish with a policy change.
The most mature programs unify media, web, CRM, and product usage data in lightweight clean rooms or privacy-safe clouds. This creates a single view of buying group engagement without exposing sensitive information. With that foundation, teams can segment by propensity and recency, not just industry and company size, which increases efficiency at any budget level.
First-party value exchanges that people welcome
Executives are more willing to share information when content provides real value. Creative digital marketing agencies craft offers people actually want, such as diagnostic tools, ROI calculators, and executive briefings. They also refine forms and progressive profiling so each subsequent ask is smaller and more contextual. Value exchanges become a trust signal rather than a barrier when done right.
Brand platforms that travel across channels
Brand is not a veneer placed on top of campaigns. It is the operating system for every growth motion. Modern brand platforms include market position, narrative architecture, visual and verbal systems, and a library of proof points and stories. Creative digital marketing agencies develop these platforms so they can scale across channels without losing clarity or distinctiveness.
Executives should insist on three outputs: a differentiated promise that anchors the value proposition, a set of narrative lanes for each audience, and a proof engine that continuously harvests customer evidence. With these in place, performance teams stop reinventing headlines and start extending a consistent story across search, social, email, web, and sales enablement.
Messaging architectures that enable speed
Long review cycles kill agility. The cure is a messaging architecture that aligns legal, compliance, and product teams on claims and disclaimers in advance. Creative digital marketing agencies bring facilitation and documentation disciplines to reach alignment early, then publish guidance that enables faster creative approvals without compromising accuracy.

Check out our work with BlueHalo
Personalization that respects compliance and elevates UX
Personalization earns trust when it is helpful and transparent. The most effective programs avoid creepy tactics and focus on utility. For example, they tailor navigation to role, surface relevant case studies by sector, and pre-populate resource centers with content aligned to the last interaction. Strategic partners rely on modular design systems so personalization does not balloon production costs.
Leading teams also implement website personalization frameworks that start small and scale. They pilot clear hypotheses, like whether a security buyer converts faster when seeing industry-specific validation, then expand only when the data supports it. This keeps resources focused and stakeholder confidence high.
Search discoverability and the rise of answer engines
Organic search remains a high-intent channel, and answer engines are reshaping how buyers discover solutions. Creative digital marketing agencies build content that wins zero-click experiences, featured snippets, and high-visibility panels. They structure pages for clarity, adopt schema where appropriate, and align topic clusters to the way executives ask questions, not just how marketers want to answer.
Technical excellence matters as much as content quality. Site speed, accessible design, and crawl-friendly architecture influence visibility. Experienced partners perform gap analyses and create roadmaps that combine quick wins with foundational improvements. Teams that want a deeper assessment often engage focused search engine optimization programs to accelerate results.
Content formats that move committees to consensus
Consensus is a content problem as much as a sales problem. Stakeholders need to digest the same story through different lenses. Creative digital marketing agencies plan content portfolios that compress time to understanding. Executive briefs translate complexity into outcomes. Solution guides answer deep technical questions. Benchmark reports and customer evidence neutralize risk objections. When each piece connects to the next, committees converge faster.
Video, interactive demos, and virtual briefings
Video shortens the distance between awareness and comprehension. It demonstrates outcomes, humanizes expertise, and scales executive access. Creative digital marketing agencies use modular production to atomize shoots into chapters, clips, and social cuts that feed multiple channels. For inspiration on how versatile modern productions can be, review a curated video portfolio that spans explainers, product demos, and customer storytelling.
Interactive demos extend attention and collect intent signals. Virtual briefings and micro-events add intimacy at scale. Each asset should have a clear role in the journey and measurable next steps. The best teams treat content like software, with versioning, telemetry, and continuous improvement.
See our video work with nShift
Demand orchestration and revenue accountability
Performance marketing is no longer a media-only discipline. It is an orchestration challenge that spans creative, data, and sales enablement. Creative digital marketing agencies align tactics to business outcomes with transparent attribution and clear service level agreements between marketing and sales. That means committing to pipeline goals, not just MQL counts, and building dashboards executives can trust.
Core practices include stage-based scoring that aligns to opportunity health, suppression logic that protects customer experience, and creative testing plans that rotate offers without fatiguing audiences. As teams mature, they adopt predictive models to prioritize accounts and time outreach. The unifying thread is shared accountability for revenue, renewal, and expansion.
What differentiates top creative digital marketing agencies
Not all partners operate the same way. The strongest performers share attributes that matter to executive buyers. They translate strategy into shippable programs quickly. Their design systems are built for scale without sacrificing craft. Their analytics separate correlation from causation. They develop clear points of view on markets instead of waiting passively for briefs. Most importantly, they create conditions for internal teams to win by building processes and assets that endure.
For B2G sellers, depth in public sector narratives is non-negotiable. Contracting cycles, mission outcomes, and acquisition pathways shape both content and channels. Working with B2G content and digital marketing experts ensures stories resonate with federal, state, and local audiences while staying compliant with procurement and privacy requirements.
Practical roadmap to implement these strategies
Leaders do not need a twelve-month overhaul to see impact. A focused 90-day roadmap can unlock momentum while laying the groundwork for scale. Creative digital marketing agencies often start with a sequence like the one below to deliver visible wins and organizational confidence.
- Clarify the growth thesis. Align on where growth will come from by segment, product, and geography. Pressure test with sales leaders and customer success.
- Audit the journey. Identify friction points from first touch to opportunity. Document gaps in content, proof, and handoffs.
- Stand up a measurement baseline. Define north-star metrics and diagnostic KPIs. Instrument a minimal dashboard and agree on definitions.
- Ship a pilot. Choose one buying group and one priority segment. Build a connected experience across three to five touchpoints with tailored content and clear next steps.
- Analyze, learn, and scale. Socialize the results, refine creative and targeting, and apply the model to adjacent segments.
Within that plan, select additional accelerators that address your most urgent constraints. If discovery is weak, invest in technical and content SEO. If the story is fragmented, refine your brand platform and message hierarchy. If conversion lags, improve page design, offers, and follow-up sequencing. The right creative digital marketing agencies will help you prioritize for maximal impact.
Check out our work with BlueAlly
Innovative tactics executives can greenlight now
The following moves are practical, budget-aware, and proven in complex markets. Each is designed to deliver measurable results while informing longer-term strategy.
- Launch an outcomes library. Package concise customer stories anchored in measurable impact. Build role-specific summaries for quick executive review.
- Deploy micro-segmentation in paid media. Replace broad targeting with tiered clusters that converge by role, industry, and current pain points.
- Modernize landing experiences. Use modular blocks to tailor value propositions, proof, and CTAs without creating endless one-off pages.
- Upgrade intent qualification. Blend behavioral and firmographic signals to route leads with precision, and suppress those still early in research.
- Institutionalize creative testing. Commit to weekly or biweekly variations of headline, visual, and offer, then elevate winners into evergreen assets.
How to align teams and budget without disruption
Change succeeds when leaders frame it as a capability upgrade rather than a reset. Establish a simple operating cadence. Weekly working sessions to unblock tasks. Monthly reviews to align on performance insights. Quarterly planning to refresh hypotheses and funding. Creative digital marketing agencies often embed with internal teams to accelerate knowledge transfer and reduce reliance on external resources over time.
Procurement becomes easier when the business case is explicit. Tie investments to pipeline coverage, opportunity velocity, and win rate. Highlight the cost of delay in markets with aggressive competitors or consolidation pressure. With a shared scorecard and a clear plan, budget shifts from cost to growth investment.
Measuring what matters and proving value
Executives want clarity, not dashboards for their own sake. The best measures answer three questions.
- Are we reaching the right audiences?
- Are we changing behavior at each stage?
- Are we creating profitable revenue?
Creative digital marketing agencies ensure instrumentation supports those questions and that insights translate into action. They also establish counter-metrics to protect customer experience, like frequency caps and suppression lists for active opportunities.
Proof does not have to wait for a full sales cycle. Early indicators include qualified meeting rates, content completion, demo requests by segment, and influenced pipeline with clear attribution logic. As momentum builds, track conversion by buying group, average deal value, and contribution to renewal and expansion.
The opportunity ahead for B2B and B2G brands
Markets are shifting, but the fundamentals remain. Distinctive brand, useful content, and respectful personalization win attention and trust. What has changed is the level of coordination required to deliver them at enterprise scale. Creative digital marketing agencies help leaders operationalize that coordination. They combine strategic clarity, exceptional creative, and rigorous analytics to create experiences that shorten decisions and strengthen relationships.
If your team is ready to advance its marketing architecture, bring in a partner that builds for impact and longevity. From portfolio positioning and narrative development to integrated media, content, and analytics, a aligned partner can transform how your brand shows up across channels and how revenue teams execute day to day.
Bluetext works with complex B2B and B2G organizations to do exactly that, across strategy, branding, and integrated programs. Explore our methodology in depth, or move straight to a focused assessment that identifies the fastest path to measurable gains. To get started, contact Bluetext for a conversation about where you are today and how we can help you build the foundations for sustained growth across your next quarter and your next horizon.
Local expertise changes outcomes. For B2B and B2G leaders, selecting a Washington DC marketing agency is not just about proximity to Capitol Hill. It is about tapping into a culture that understands policy, procurement, and public opinion, and can translate those dynamics into growth. A Washington DC marketing agency combines policy fluency with performance marketing, delivering brand strategies and demand programs that resonate with officials, program managers, industry analysts, and enterprise buyers across the Beltway and beyond.
What makes a Washington DC marketing agency different?
A Washington DC marketing agency sits at the intersection of policy, power, and press. That vantage point means faster pattern recognition on regulatory shifts, market access programs, and funding priorities, as well as sharper instincts for how to position complex solutions for skeptical decision makers. The best teams have daily contact with associations, think tanks, and congressional staff, which shortens the distance between message development and market traction.
Unlike generalist firms, a Washington DC marketing agency like Bluetext is built for complexity. It knows how to distill long sales cycles into measurable milestones, how to shape narratives that satisfy compliance while still converting, and how to orchestrate campaigns that reach targets inside and outside of government. This blend of policy literacy, enterprise-tech depth, and performance rigor creates a strategic advantage for companies operating in regulated sectors or selling into the federal market.

Check out our work with Aechelon
How local insight improves B2G and regulated-industry campaigns
Executives often ask why a Washington DC marketing agency drives stronger results in public sector and adjacent markets. The answer is access and context. Access to subject matter experts enables fast-turn content that aligns with current policy debates and budget windows. Context about agency structures, acquisition timelines, and oversight boards refines targeting, creative, and channel mix.
For organizations navigating federal, state, or municipal environments, a Washington DC marketing agency can act as an interpreter. It maps customer journeys that include program offices, integrators, and primes, then designs campaigns to influence each touchpoint. It equips sales teams with compliant enablement materials, and it aligns brand credibility with mission outcomes. That is difficult to replicate without an on-the-ground team that understands the nuances of appropriations cycles, RFI responses, and vehicles like GWACs and IDIQs.
What does a Washington DC marketing agency bring to B2G go-to-market?
Winning in B2G requires synchronized strategy, creative, and capture support. A Washington DC marketing agency is adept at integrating brand positioning, persona-driven messaging, and account-based marketing into a cohesive program that aligns with procurement horizons. The work starts with stakeholder mapping and messaging frameworks tailored to mission, risk, and value realization. It continues with channel plans that blend paid, earned, shared, and owned to reach decision makers where they are, from industry publications to committee briefings.
If your organization sells to public sector buyers, partnering with a public sector digital marketing agency ensures that demand programs reflect the real structure of government decision making. That alignment pays off in higher response rates, stronger thought leadership placements, and more credible sales conversations. It also speeds internal approvals since content and creative are built with compliance and clearance in mind.
How case experience accelerates execution
Experience in mission-critical categories compresses time to value. A Washington DC marketing agency that routinely collaborates with primes, emerging tech vendors, and systems integrators understands the language of cybersecurity, data analytics, logistics, and critical infrastructure. The ability to translate technical depth into policy-centric outcomes is a competitive advantage.
Reviewing examples is instructive. See how Bluetext approaches sector challenges through our work with government contractors, where brand modernization and demand generation drive differentiation at the edge of innovation. Patterns repeat across programs, which means insights gained in one engagement often strengthen the next.
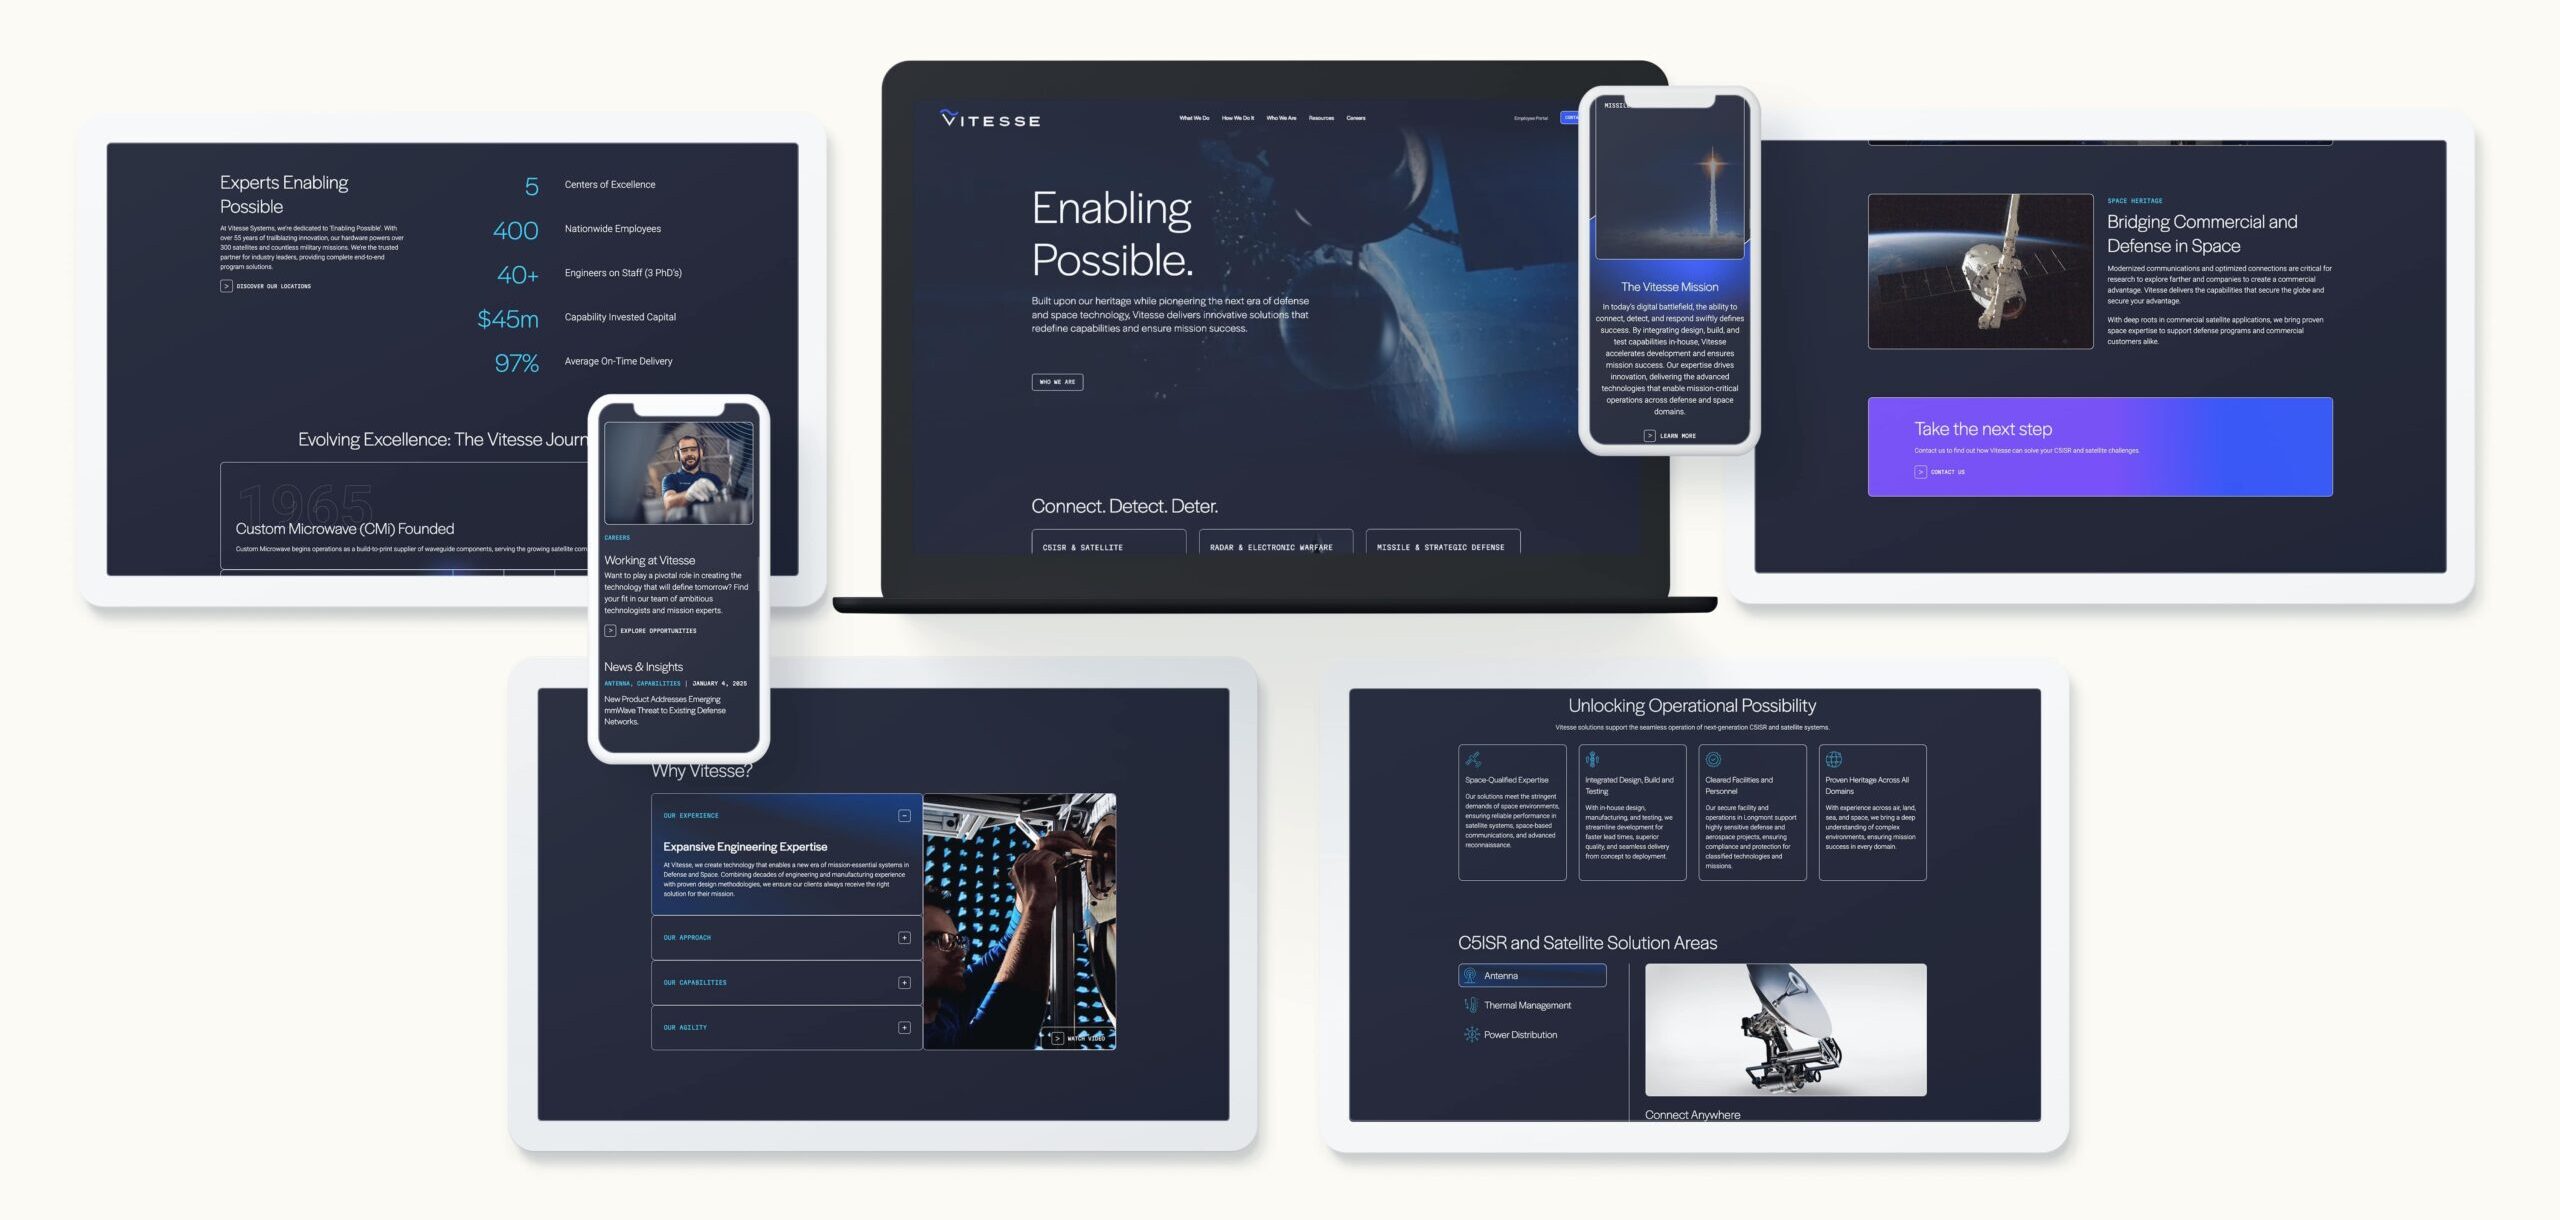
Check out our work with Vitesse
How a Washington DC marketing agency improves SEO and AEO
Executives increasingly prioritize answer-engine optimization for buying groups that begin with research questions, not product names. A Washington DC marketing agency has a distinctive edge in SEO because it can embed policy terms, funding priorities, and compliance queries into content that actually answers what officials and evaluators are searching for. It knows how to build topic clusters around mission outcomes, how to structure pages that resolve intent, and how to measure visibility among niche audiences.
Effective SEO is not just metadata. It requires keyword strategies tethered to federal calendars, schema markup aligned to thought leadership, and a publishing cadence that reflects legislative and budget cycles. Bluetext’s search engine optimization work is built to win in these conditions, with on-page technical rigor and editorial strategies that surface qualified traffic ready for sales engagement. When executed correctly, a Washington DC marketing agency can convert policy-driven searches into pipeline by meeting intent with substance.
How proximity to policymakers sharpens thought leadership
Thought leadership cuts through when it connects policy to practical outcomes. A Washington DC marketing agency can validate topics with former officials, association leaders, and academic experts, which elevates credibility and relevance. That proximity also fosters timely commentary when hearings, reports, or directives change the conversation. Rapid response content, paired with earned media outreach, positions brands as trusted advisors to both government and industry.
This is particularly critical for categories like cybersecurity, healthcare, energy, and transportation, where legislation and standards heavily influence buyer priorities. A Washington DC marketing agency can help executives frame perspectives that are both visionary and grounded in how agencies evaluate risk and readiness.
Creative that understands the Beltway audience
Creative effectiveness depends on context. Inside the Beltway, visuals, language, and stories must align with mission, stewardship, and trust. A Washington DC marketing agency builds campaigns that respect the public mandate while still commanding attention. It uses policy-aware language, avoids overstatement, and focuses on outcome storytelling that resonates with program goals.
If you are evaluating partners, review what it means to be a top creative agency in DC. Look for work that demonstrates brevity without simplification, distinctive design without theatrics, and a clear line from creative concept to measurable performance. Those traits reflect a team that knows how to persuade discerning audiences who must justify every dollar spent.
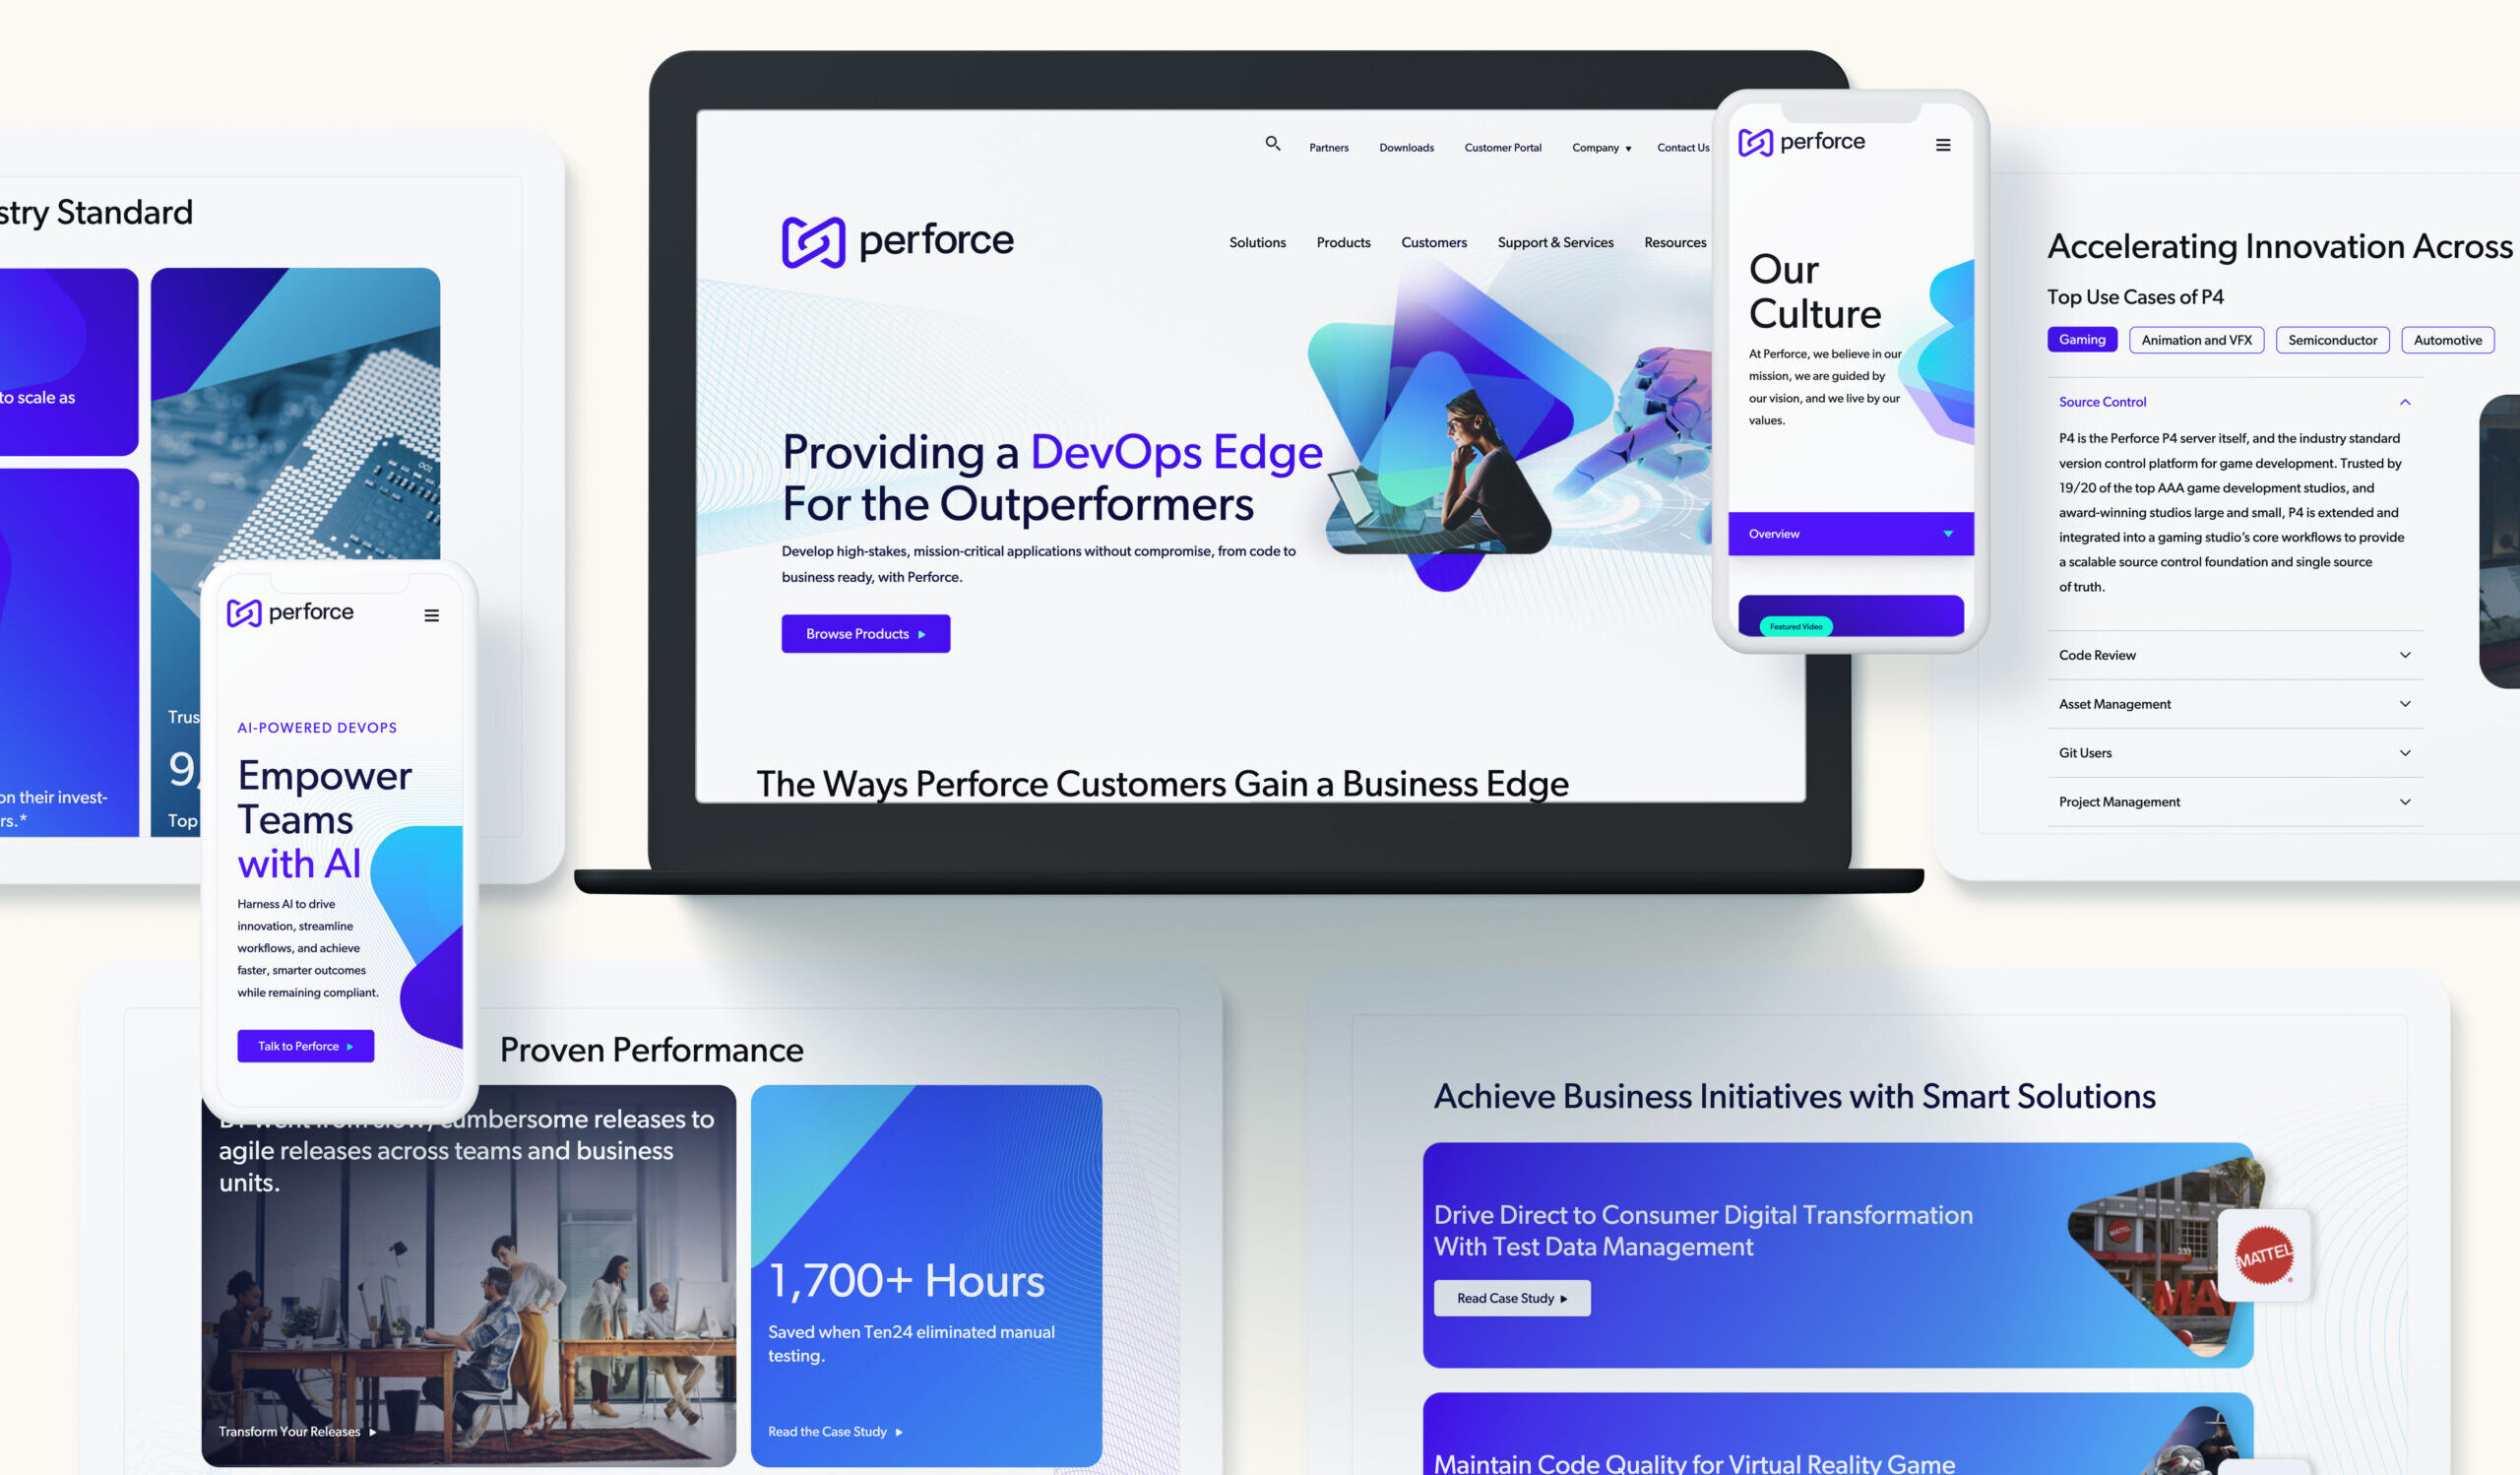
Check out our work with Perforce
Event, trade show, and ABM activation inside the Beltway
The DC region hosts a dense calendar of policy forums, industry gatherings, and agency-specific events. A Washington DC marketing agency turns these moments into performance engines through pre-event ABM outreach, on-site experiences, and post-event nurture. The goal is not just foot traffic. It is orchestrated engagement that moves targeted accounts from awareness to conversation to capture support.
For in-person and hybrid programs, strong activations rely on message discipline and flawless logistics. If events are a core growth lever, examine how an agency approaches trade shows and events. You should see integrated creative, interactive demos designed for complex buyer journeys, and intelligence loops that convert booth interactions into sales-ready signals.
What to look for when selecting a Washington DC marketing agency
Choosing the right partner requires more than a portfolio review. Use the criteria below to evaluate fit and impact:
- Policy fluency: Can the team explain how current directives and funding priorities affect your pipeline, and reflect that in messaging and creative?
- Category depth: Does the agency have repeatable success in your sector, including regulated industries and B2G?
- Go-to-market integration: Will strategy, brand, content, media, and analytics operate as one program with shared KPIs?
- Executive access: Can they put senior strategists and creatives in the room with your leadership and SMEs when it matters?
- Measurement maturity: Are they prepared to connect brand and demand to attributable revenue and contract wins?
- Speed to value: Do they have proven processes for discovery, approvals, and production that accommodate stakeholder complexity?
A Washington DC marketing agency that excels in these areas can reduce risk, accelerate outcomes, and strengthen cross-functional alignment between marketing, sales, and capture teams.
Check out our work with Kratos
Measurement that ties brand to pipeline
Local expertise should show up in the numbers. A Washington DC marketing agency brings a measurement plan that reflects long sales cycles and multi-stakeholder influence. That includes tracking influence across executive briefings, thought leadership readership among policy audiences, account progression in ABM programs, and qualified lead conversion against target vehicles and contract timelines.
Executives should expect clear dashboards and decision support. That means attribution models that balance first-touch and multi-touch realities, reporting that aligns with capture milestones, and insights that guide budget reallocation without waiting for quarter-end. The right Washington DC marketing agency will stand up this infrastructure early so performance signals inform strategy throughout the engagement.
Brand architecture for complex portfolios
Many organizations serving the public sector manage intricate portfolios created through M&A or multi-solution growth. A Washington DC marketing agency like Bluetext can rationalize brands, rename products to fit mission narratives, and redesign identity systems that scale across business units and contract vehicles. This is not just visual refinement. It is a way to reduce confusion in the market and to give sales teams simple, credible stories that align with how government buyers evaluate vendors.
Clarity pays dividends in credibility. When solutions map cleanly to mission outcomes, when value propositions read like answers to program requirements, and when visuals reinforce trust, you shorten the distance from first impression to shortlist. A Washington DC marketing agency, informed by the rhythm of federal buying, will prioritize that clarity.
Content strategies that mirror the buyer’s path
High-performing content strategies start with audience intent. A Washington DC marketing agency knows how to design editorial calendars that parallel solicitations, compliance checkpoints, and executive policy cycles. It balances cornerstone thought leadership with agile commentary, and pairs educational assets with conversion paths designed for capture support.
For B2B audiences adjacent to government, the same rigor applies. Strategy documents, technical briefs, and case stories need to speak to governance, risk, and workforce impact. A Washington DC marketing agency builds content that proves credibility without overwhelming the reader, then packages it for distribution across owned, earned, and paid channels.
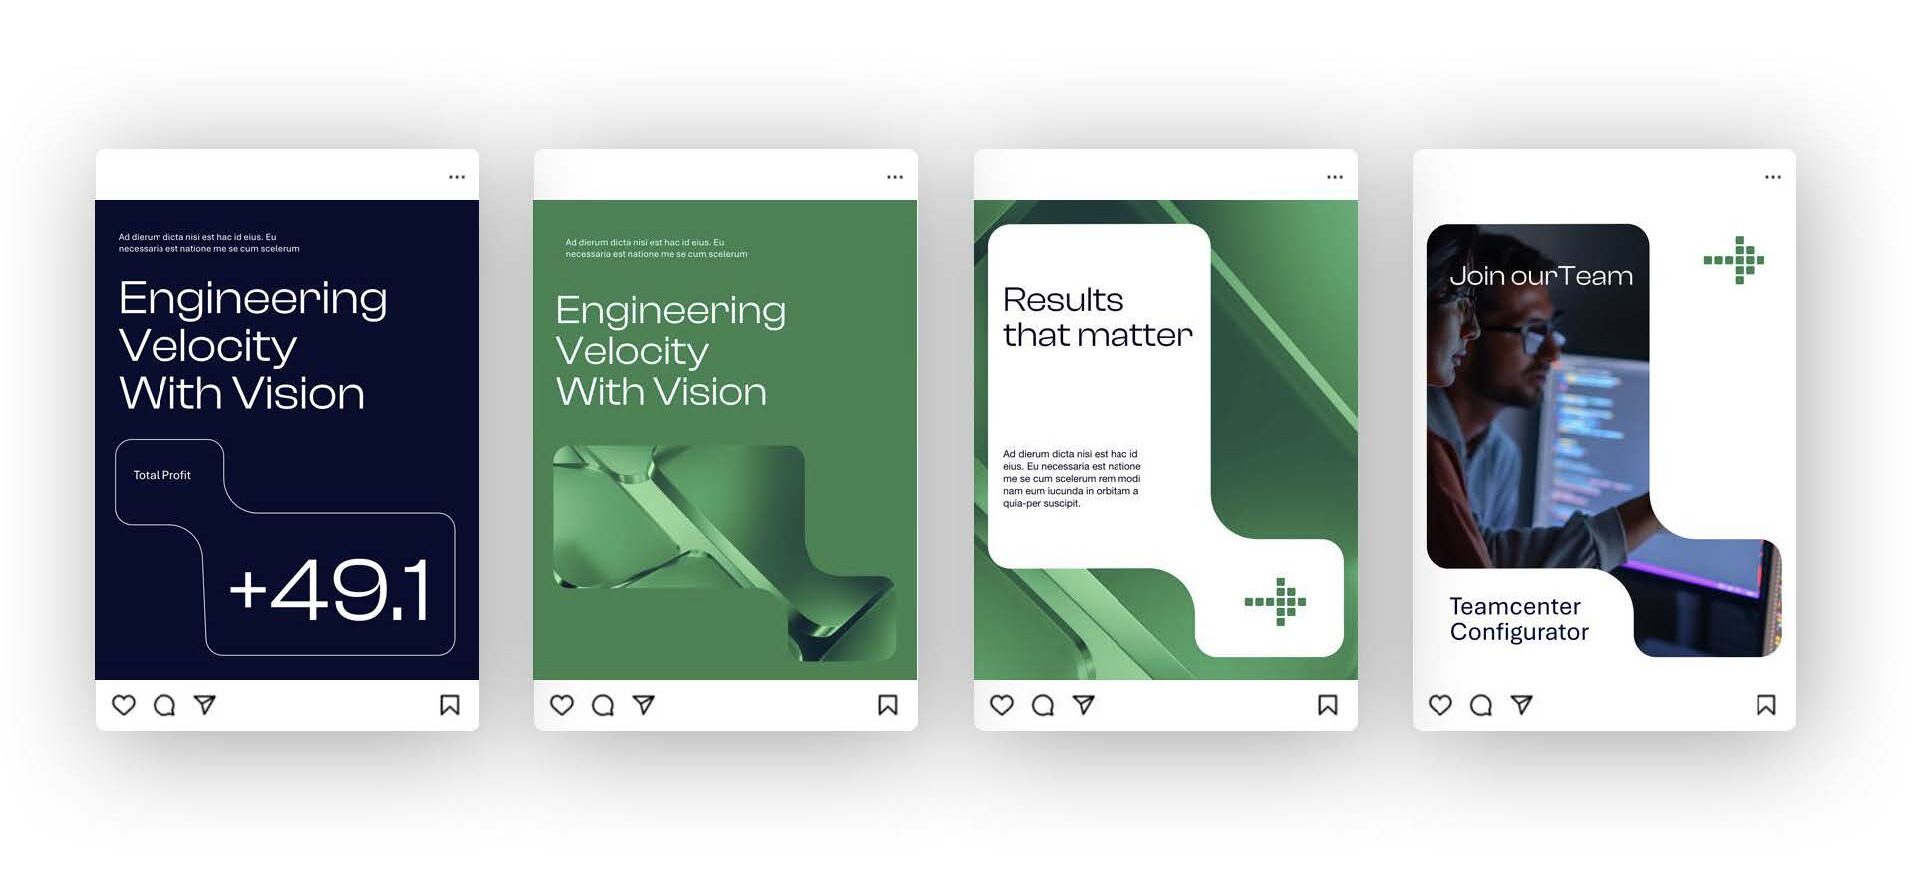
Check out our work with Sabel Systems
Media relations and public affairs integration
Media relationships in Washington are shaped by substance. Reporters and editors expect clear expertise and original insights supported by data. A Washington DC marketing agency cultivates those relationships with consistent, high-value interactions, not sporadic pitches. The result is a media program that complements demand generation, reinforces leadership positioning, and mitigates risk when issues arise.
Public affairs integration matters as well. The line between marketing and policy conversations is thin in this market. A Washington DC marketing agency can coordinate message calendars, ensure compliance, and maintain alignment between external communications and government relations. That alignment protects brand equity and strengthens trust with stakeholders.
Operational advantages of a DC-based team
There are practical benefits to geography. A Washington DC marketing agency can convene stakeholders quickly for workshops and approvals. It can staff events, capture executive video content, and facilitate analyst or media meetings with less lead time. For fast-moving campaigns tied to hearings, releases, or budget decisions, that responsiveness is a force multiplier.
A DC-based team also knows the venues, vendors, and processes that keep production smooth. From secure facilities for executive briefings to specialized photographers familiar with federal sites, the logistical network improves quality and speed. In a market where timing is often decisive, these operational advantages translate directly into performance.
Common use cases that benefit most from local expertise
While nearly any growth initiative can gain from local insight, certain programs see outsized returns with a Washington DC marketing agency:
- Brand relaunches and repositioning tied to a shift into public sector or regulated industries
- ABM programs aimed at agencies, integrators, and primes with complex buying committees
- Content and thought leadership built around policy milestones or standards adoption
- Event-centered growth tied to federal trade shows, executive roundtables, and policy forums
- Search strategies that require precise alignment with mission, compliance, and funding terms
In each case, a Washington DC marketing agency brings speed, relevance, and credibility that elevate outcomes over national generalists.

Why Bluetext
Bluetext has earned its reputation by solving complex growth challenges for global brands, innovators, and government-focused enterprises. We combine strategy, brand, creative, and performance with a deep understanding of the DC ecosystem. Whether you need to enter the public sector, scale account-based programs, or modernize your brand for a regulated audience, a Washington DC marketing agency with Bluetext’s track record delivers results that stand up in the boardroom and on the capture plan.
Next steps
If your organization is ready to turn proximity into performance, partner with a Washington DC marketing agency that understands policy, procurement, and pipeline. Explore how Bluetext can support your strategy, branding, and campaign needs, then contact Bluetext to start a conversation with our leadership team. We will meet you where you are, define a path to measurable impact, and build programs that move markets across the Beltway and beyond.
Technology is rewriting the rules of market differentiation, sales velocity, and stakeholder trust. Strategy still determines where to play and how to win, but execution increasingly depends on data pipelines, connected platforms, and creative that adapts in real time. This is why Washington DC marketing firms have become catalysts for growth across B2B and B2G. They sit at the crossroad of policy, procurement, and product innovation, pairing enterprise-grade strategy with the tools to deliver measurable outcomes. For executive teams tasked with capturing share in complex ecosystems, Washington DC marketing firms like Bluetext offer a pragmatic path to align positioning, pipeline, and performance.
Check out our work with Kratos
What sets DC-based firms apart in B2B and B2G
While many agencies claim integrated capabilities, Washington DC marketing firms are built around realities that other markets rarely face. They operate in sectors where credibility is a currency, compliance is a given, and purchase decisions involve committees with technical, legal, finance, and mission stakeholders. That environment demands a discipline that blends category expertise, analyst-informed messaging, and marketing operations that can withstand scrutiny from procurement and security teams.
Proximity matters. Washington DC marketing firms track shifts in regulation, funding cycles, and agency priorities, then translate them into audience insights and demand plays. The result is strategy that connects big themes like modernization, cybersecurity resilience, or AI governance to tightly defined solution narratives and programs that move pipelines forward.
Understanding procurement cycles and buying committees
Federal and regulated market opportunities often move through long cycles with hard gates. Washington DC marketing firms design content, events, and outreach that match each step, from early market research and draft RFPs to post-award adoption. Instead of generic nurture, you get precise engagement plans aligned to program milestones, teaming dynamics, and influencer maps inside agencies or Fortune 1000 buyers.
Compliance, accessibility, and security by design
Trust is nonnegotiable in public sector and critical infrastructure. Leading Washington DC marketing firms build creative and digital experiences with accessibility and privacy in mind. That includes Section 508, WCAG conformance, data minimization, and tight governance for marketing tech stacks. Content is vetted for factual rigor and defensible claims, reducing risk while accelerating approvals.
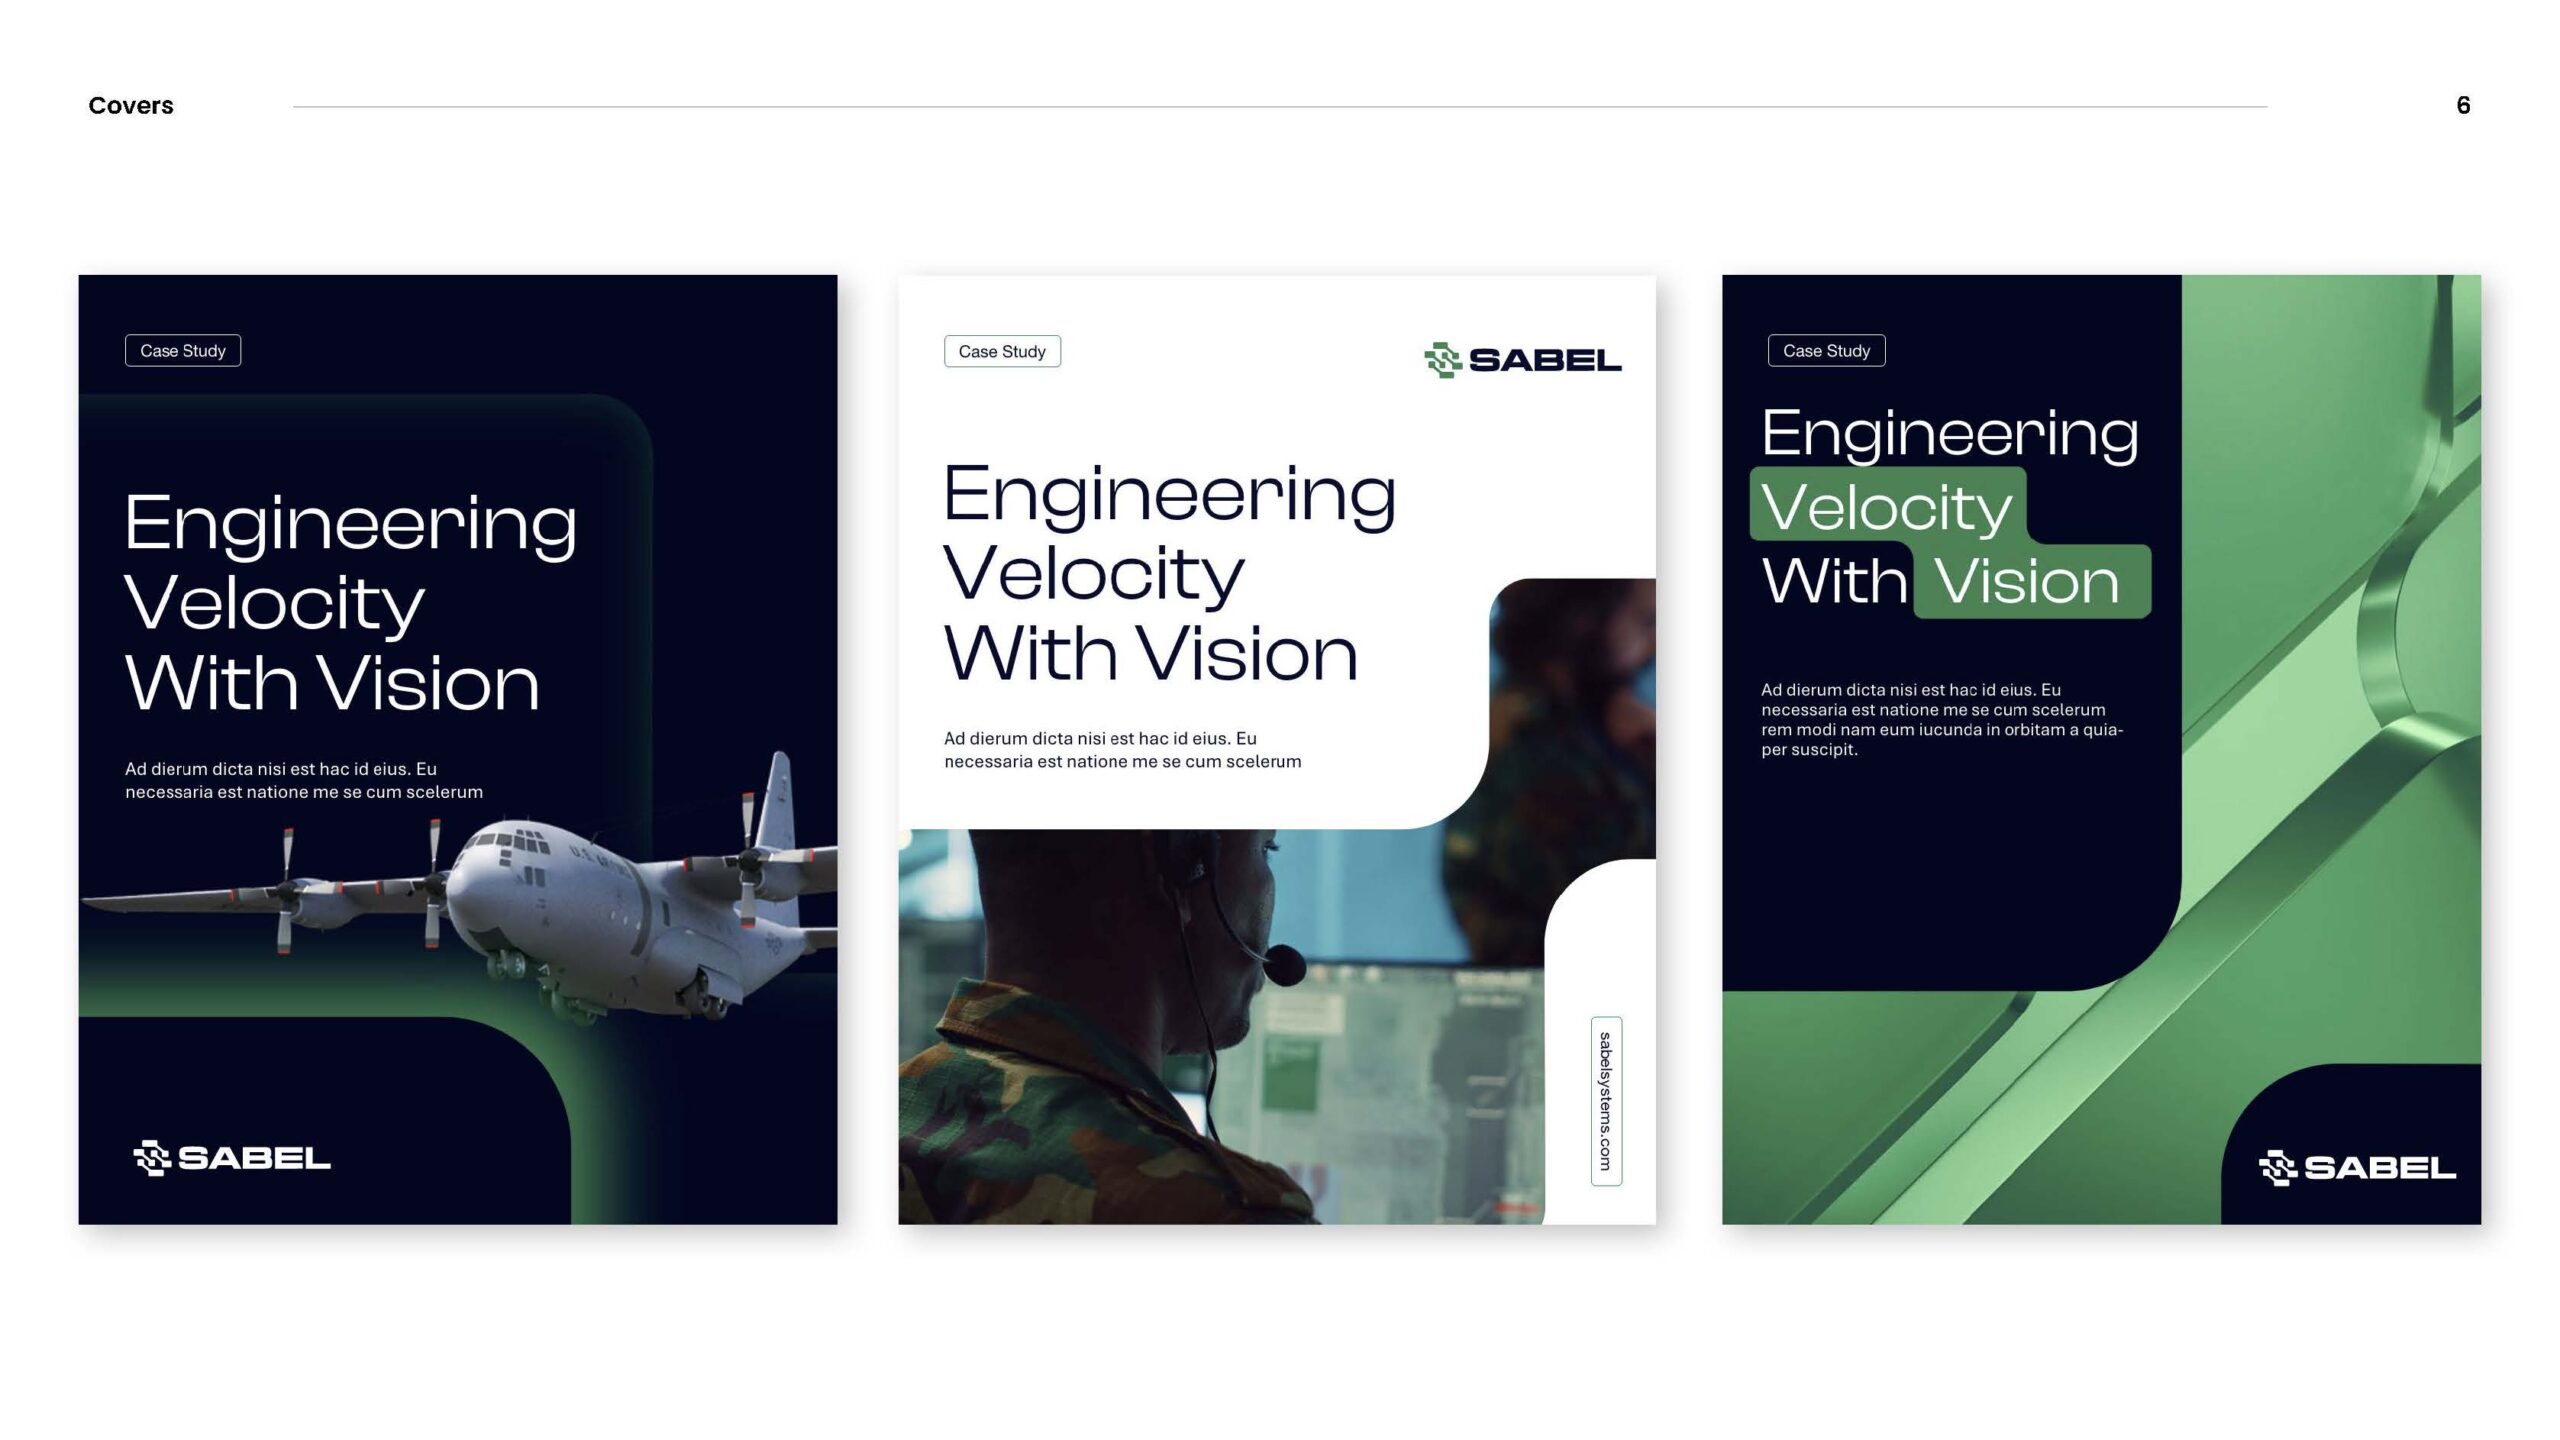
Check out our work with Sabel Systems
How DC firms bridge technology and strategy
Bridging technology and strategy starts with the operating model. Washington DC marketing firms connect executive positioning with the pipelines, dashboards, and creative systems that turn strategy into outcomes. The work spans insight, architecture, activation, and optimization.
From data strategy to activation
Strong programs start with an evidence base. Audience segmentation leverages intent data, CRM signals, and program performance to isolate segments that match growth priorities. Washington DC marketing firms then map those segments to message frameworks, content architectures, and channel mixes. Activation plans coordinate paid, owned, earned, and field motions so each touch speeds consensus across technical and business buyers.
Integrating martech with sales orchestration
Campaigns perform when tech stacks are aligned. Washington DC marketing firms support their clients by standardizing taxonomies, defining UTM governance, and integrating marketing automation with CRM. That creates reliable attribution and shortens time to insight. The best partners can pivot budgets within a quarter based on real performance, feeding wins back into content and creative for compounding returns.
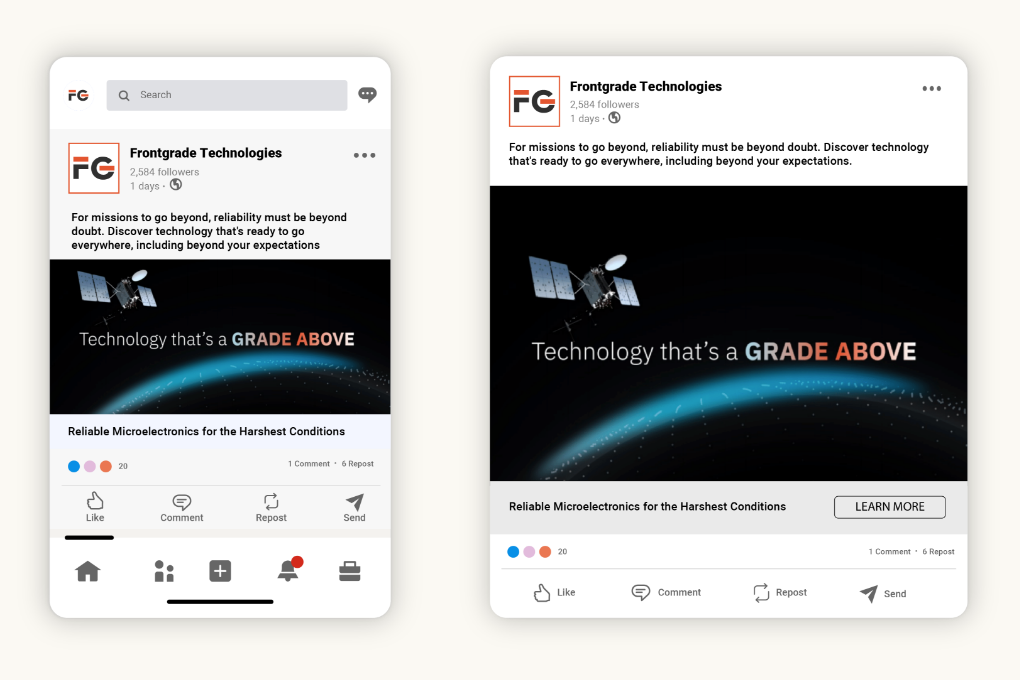
Check out our work with Frontgrade
Positioning that accelerates complex deals
In categories like cybersecurity, data platforms, logistics, healthcare, and national security, differentiation is not about louder claims. It is about clarity, use cases, and proof. Washington DC marketing firms develop messaging that speaks to mission outcomes and business impact, then show the math with case stories, demos, and third-party validation. Executives see the connection between the brand promise and pipeline progression in high-value accounts.
Thought leadership that earns trust
Senior audiences do not want product brochures dressed up as insights. Washington DC marketing firms build editorial programs that tackle policy shifts, technical tradeoffs, and operational realities. The approach often includes research-backed reports, C-level roundtables, and targeted media programs that position leaders as stewards of change. Over time, this thought leadership becomes a flywheel for account-based marketing and partner enablement.
Account-based marketing for enterprise and public sector
ABM succeeds when strategy, content, and operations move in unison. Washington DC marketing firms help their clients orchestrate tiered programs from one-to-one to one-to-few motions. Each account’s strategy aligns to the opportunity landscape, decision criteria, and competitive dynamics. Content is personalized at the problem level, not just the logo level, so every touch adds substance and momentum.
Field, events, and briefing centers
In-person engagement still drives trust in high-stakes markets. Washington DC marketing firms design executive briefings, roadshows, and tradeshow strategies that amplify thought leadership and turn meetings into next steps. Tight coordination with SDR and capture teams ensures fast, relevant follow-up. The output is pipeline, not just presence.

Search visibility as a revenue lever
Organic visibility is the first conversion for many decision makers. Washington DC marketing firms treat SEO and AEO as a strategic capability, not a checklist. Work includes intent-aligned keyword portfolios, technical audits, and content hubs that answer executive questions and practitioner needs. Measurement ties rankings and traffic to meaningful conversions and late-stage influence, not vanity metrics. For organizations investing in this capability, rigorous search engine optimization discipline becomes a compounding growth asset.
Digital experiences built for conversion
Websites must serve analysts, procurement officers, engineers, and C-level buyers at once. Washington DC-based marketing firms define information architectures that guide each visitor type to proof, demos, and next steps quickly. Design and copy collaborate to reduce friction across journeys. On the backend, experimentation frameworks validate changes with real data. A conversion-optimized foundation for website design and development often unlocks efficiencies across the entire funnel.
Measurement that earns board confidence
Executives need to see the line from investment to impact. Washington DC marketing firms implement measurement frameworks that segment outcomes by market, product line, and account tier. Multi-touch attribution is balanced with cohort analysis for long cycles. Dashboards roll up to a simple narrative: what worked, what did not, and what to do next. The precision helps marketing defend budgets and inform product, pricing, and route-to-market decisions.
Attribution in long buying cycles
Attribution is never perfect, but it can be fit for purpose. Washington DC marketing firms use hybrid models that weight executive content, events, and partner influence alongside digital conversions. The key is governance and consistency, so trend lines guide real budget shifts rather than opinion. Over time, the organization builds institutional memory that de-risks decisions.
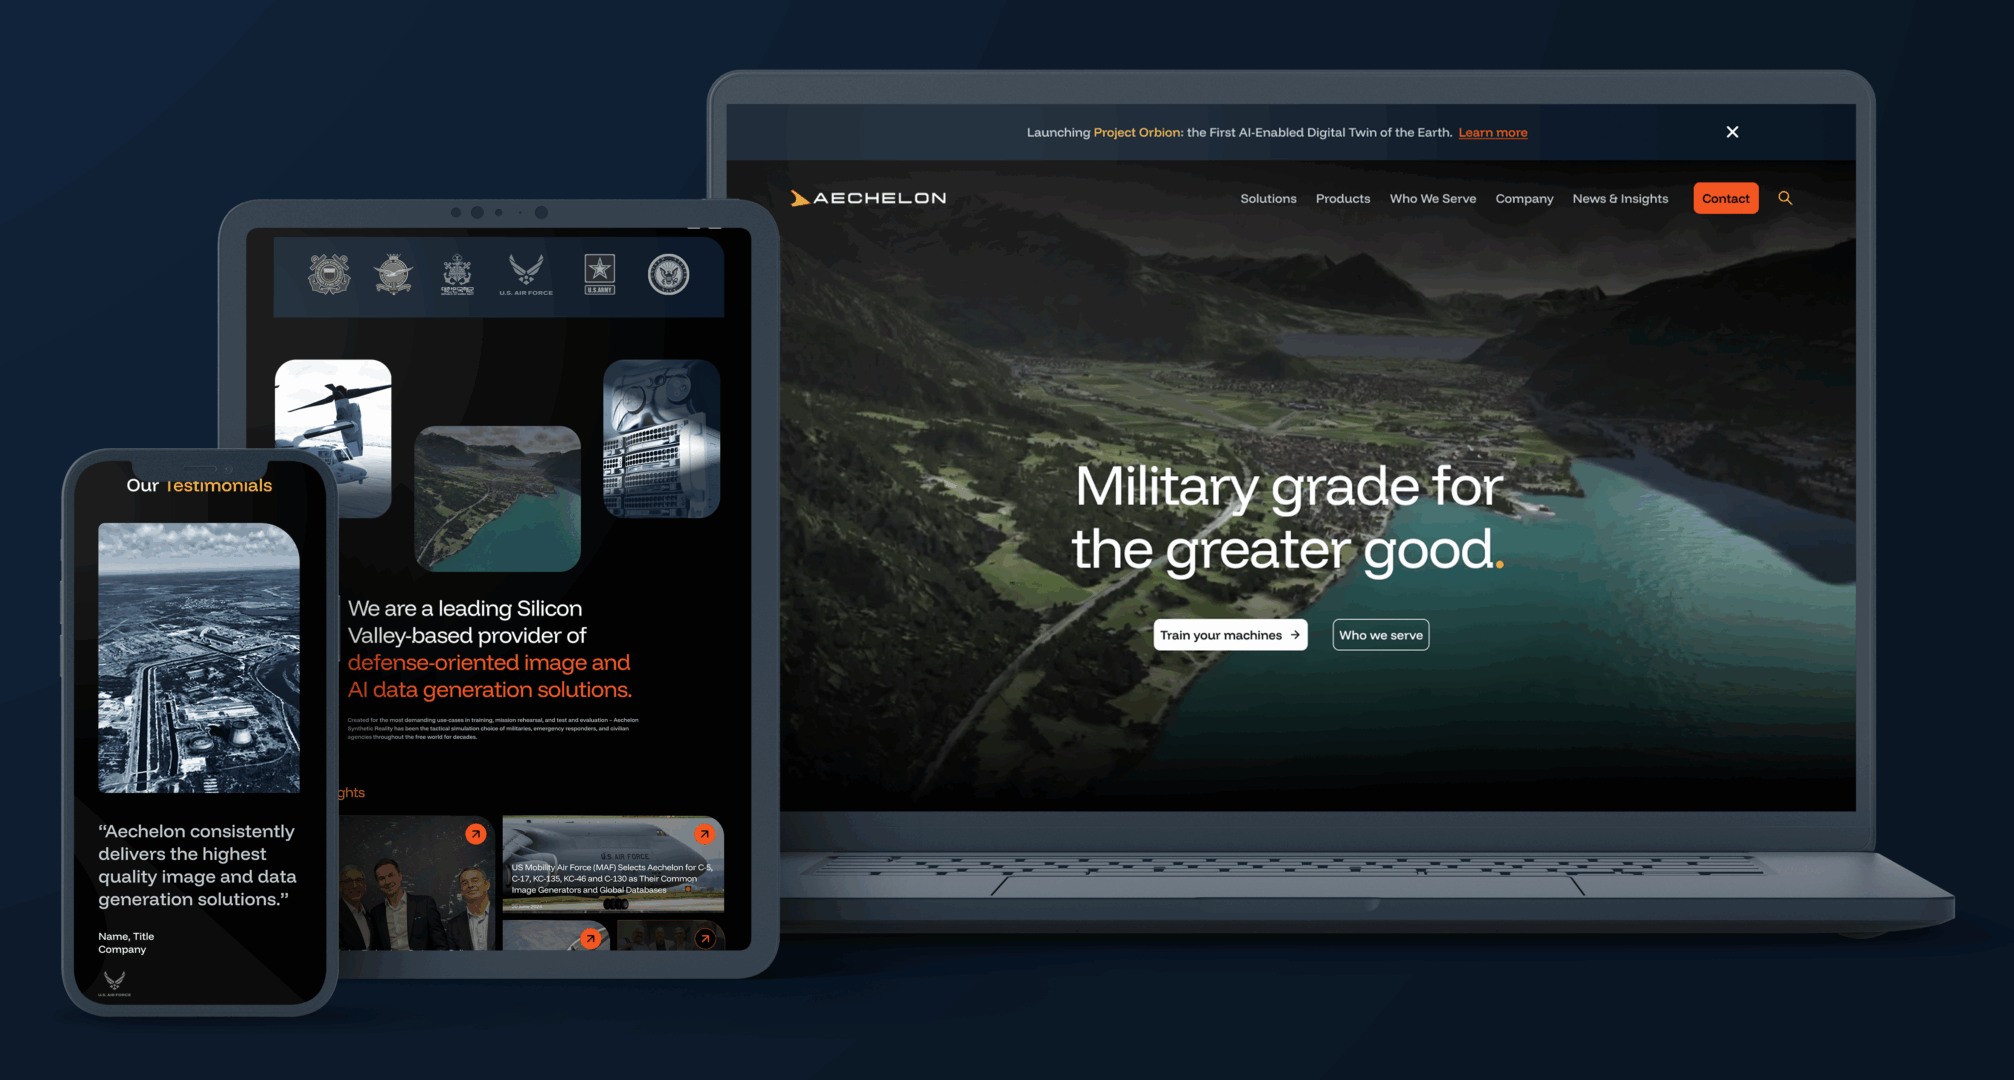
Check out our work with Aechelon
How to evaluate Washington DC marketing firms
Choosing a partner is a high-stakes decision. Use this checklist to separate rhetoric from readiness.
- Category fluency: Ask for examples in your exact segment and buyer type. The best Washington DC marketing firms bring nuanced understanding of procurement, compliance, and competitive dynamics.
- Strategy-to-ops linkage: Look for teams that connect positioning to channel plans, content architectures, and sales orchestration. Ask how they will operationalize your story within your stack.
- Measurement plan: Require a clear methodology for targets, attribution, and reporting cadences. Washington DC marketing firms should define KPIs that the board respects.
- Security and compliance: Validate processes for accessibility, privacy, and data governance. Public sector and regulated buyers will ask. Your partner must answer.
- Change management: Assess how the firm leads workshops, aligns stakeholders, and trains your team. Great ideas die without adoption.
Common pitfalls to avoid
Even strong programs stall when basic risks are ignored. Washington DC marketing firms help clients avoid these traps, but internal alignment is still required.
- Strategy without enablement: Messaging guides nothing if sales and partners cannot use it. Build toolkits and train relentlessly.
- Content that misses the buyer: Executive priorities differ from practitioner needs. Segment topics, depth, and tone to match each audience.
- Fragmented data: Inconsistent taxonomies and loose tracking cripple insights. Establish governance on day one.
- Underpowered creative: Regulated markets do not require boring work. Washington DC marketing firms use bold but credible creative to break through safely.
- Short-term bias: Complex markets reward compounding investments. Balance demand sprints with brand and SEO programs that pay for years.
Emerging trends DC leaders are operationalizing
Marketing sits at the center of transformational themes. Washington DC marketing firms convert these trends into practical playbooks.
- AI augmentation: From audience modeling to creative iteration, AI speeds cycles and expands testing. Governance and human oversight keep outputs on brand and on brief.
- Privacy-centric growth: Signal loss requires new data strategies. First-party data capture and contextual programs replace over-reliance on third-party cookies.
- Accessibility as advantage: Inclusive design is both compliance and conversion. It increases reach while protecting the brand.
- Partner ecosystems: Alliances and integrators influence big deals. Programs must co-market and co-sell with clarity on joint value and pipeline impact.
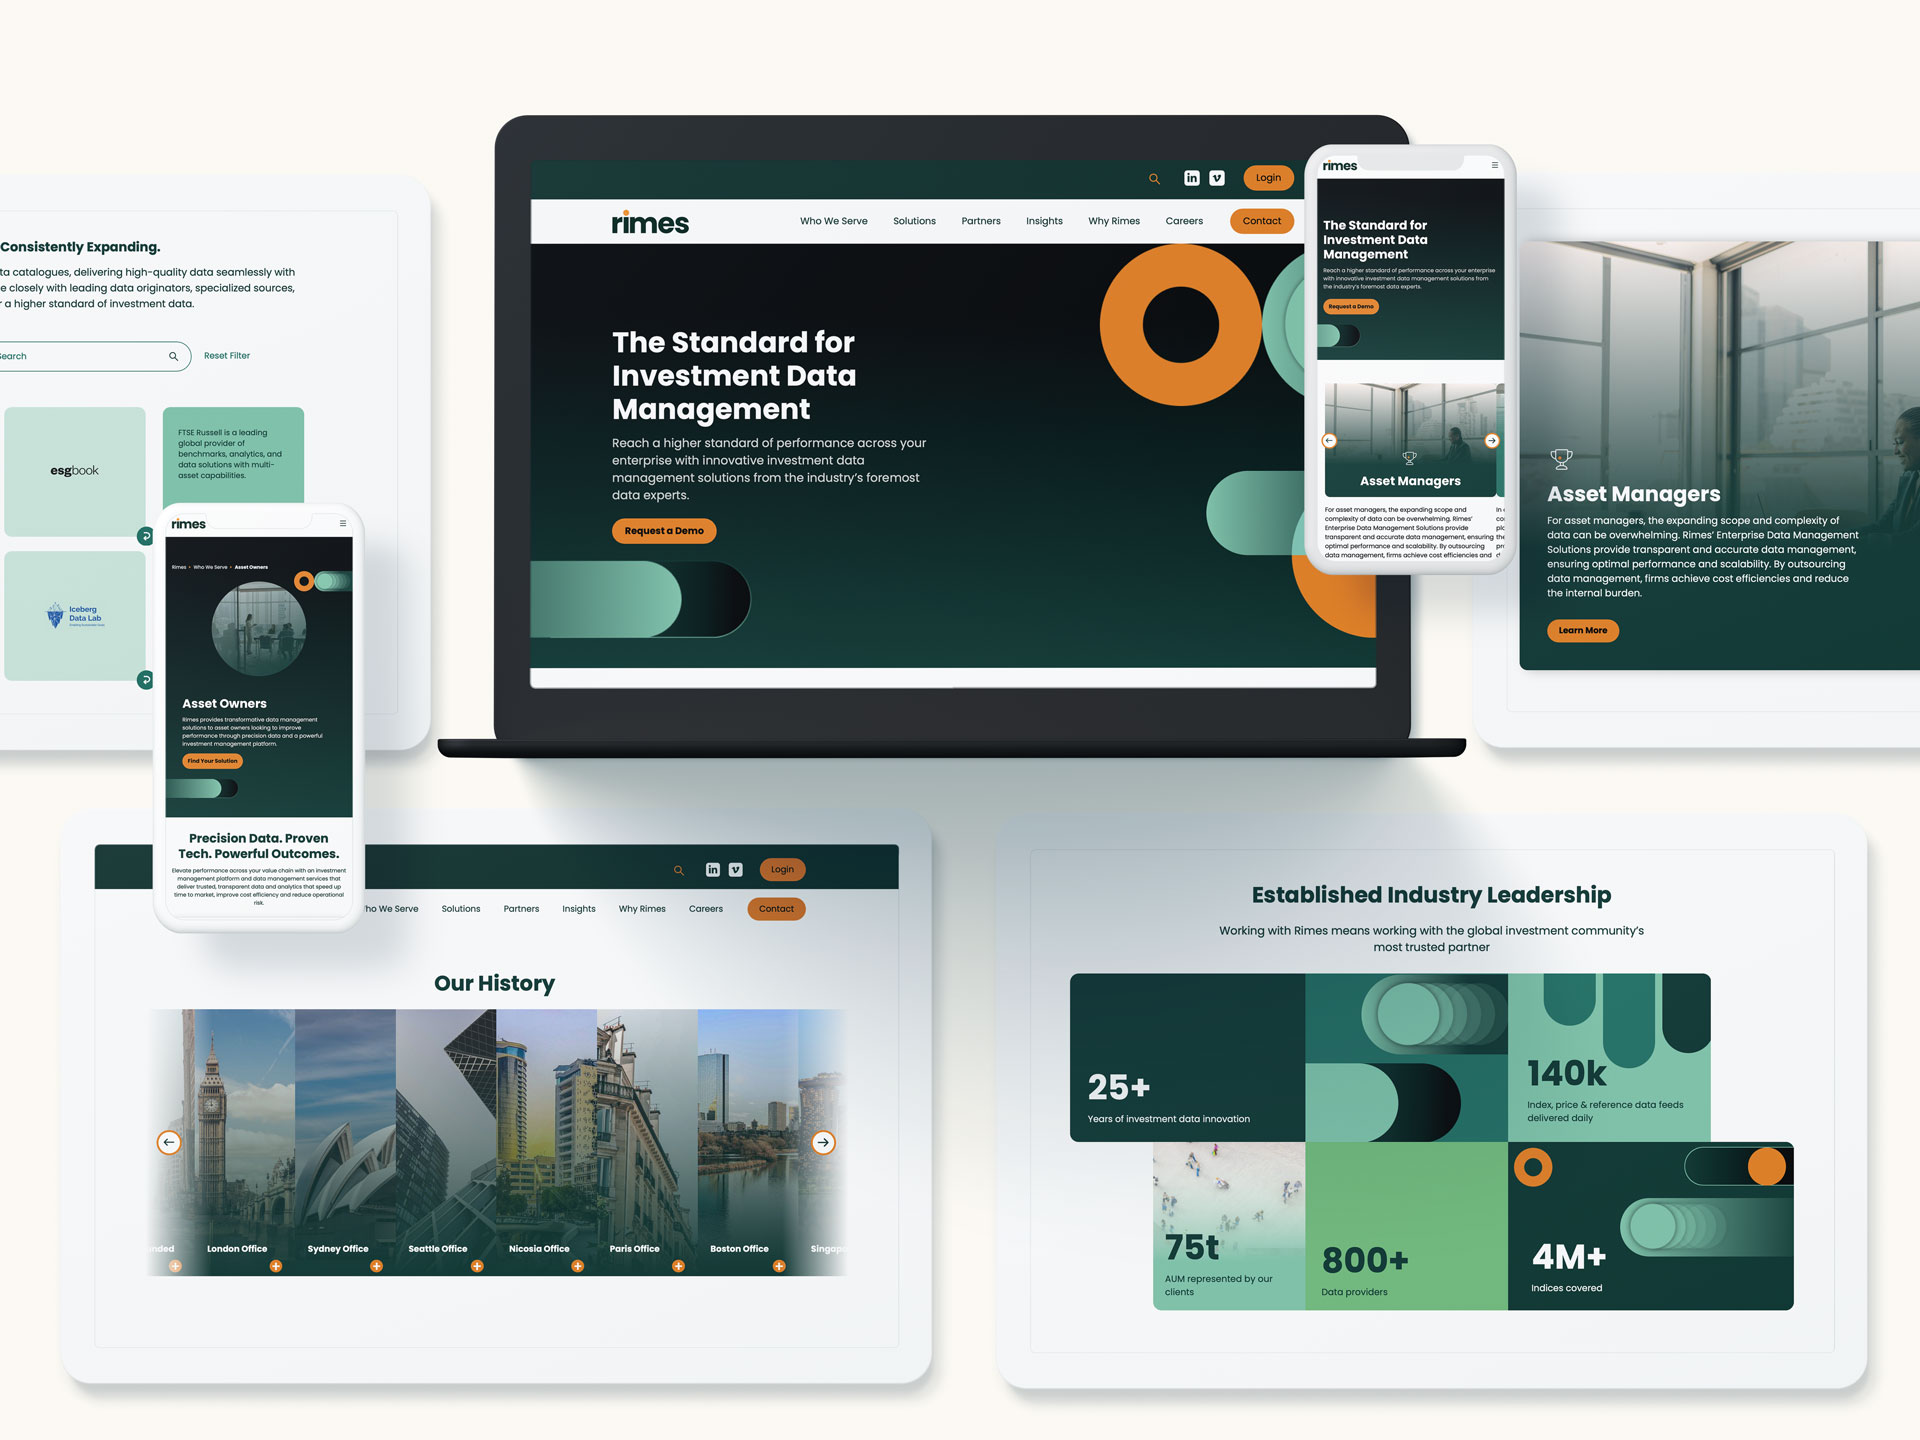
The DC advantage for integrated campaigns
Integrated programs demand program management and creative agility. Washington DC marketing firms build strategies that mirror your operating model and run sprints with clear owners. They anticipate legal review cycles, compliance checks, and leadership visibility. Most important, they protect momentum by staging workstreams so creative, media, web, and sales enablement move in lockstep rather than wait on one another.
From brand to pipeline in one roadmap
Executives want both long-term brand value and near-term revenue. Washington DC marketing firms like Bluetext create roadmaps that start with positioning, then immediately translate the story into ABM plays, web upgrades, and media flights. This flow eliminates internal lags and produces early wins that fund further transformation.
Why partner with Bluetext
Bluetext has helped growth-stage innovators, enterprise leaders, and mission-driven organizations turn complex narratives into momentum. As a full-service B2B marketing agency that lives at the intersection of brand, demand, and digital, our teams bring the rigor of Washington DC marketing firms to every engagement. We pair research-driven messaging with creative that earns attention and operations that scale. Our specialists in B2G marketing understand the nuances of the public sector, while our digital teams deliver the platforms and workflows that convert.
Clients choose us for launch programs that reposition categories, ABM that moves enterprise deals, and digital ecosystems that align product, sales, and partner motions. Whether you need to modernize your web presence, unlock demand through media and content, or operationalize analytics across regions, we bring a playbook proven in the most demanding markets. If you want the strategic discipline and executional horsepower of Washington DC marketing firms in one partner, we are ready to help. Contact us to align your brand, campaigns, and digital experience around growth. Reach out to Bluetext to discuss strategy, branding, or campaign support that bridges technology and strategy and turns your goals into measurable results.
Prefer listening over reading? Check out the podcast version of this blog below and enjoy insights on the go!
Washington DC sits at the intersection of policy, procurement, and technology. For leaders selling into government, this nexus is where strategy becomes opportunity. The most effective path to growth in the public sector is not a repackaged B2B playbook. It is a specialized approach designed for federal, state, and local buyers who value mission outcomes, security, accessibility, and proof of performance. That is where marketing agencies in Washington DC distinguish themselves. By pairing Beltway fluency with modern growth tactics, they drive B2G innovation that converts complex buying cycles into predictable pipeline.
Why DC agencies have an edge in B2G
Proximity to federal decision makers, industry associations, and prime contractors helps marketing agencies in Washington DC track real-time shifts in policy, funding, and mission priorities. This closeness accelerates insight gathering, informs positioning, and keeps campaigns aligned with the programs and initiatives that matter most to public sector buyers.
Beyond access, marketing agencies in Washington DC bring institutional knowledge that spans compliance, contracting vehicles, and acquisition timelines. They understand how agencies define risk, the role of influencers like program managers and system integrators, and how to translate technical capabilities into measurable mission impact. That understanding sets the tone for every creative choice, content plan, and media investment.
What differentiates successful B2G go-to-market strategies
Winning in the public sector requires a layered approach that starts with clarity on mission outcomes, not product features. The top marketing agencies based in Washington DC prioritize message architectures that tie capabilities to agency priorities, from zero trust to citizen experience to supply chain assurance. They communicate value in the language of procurement and policy, then prove it with evidence that satisfies both technical evaluators and executive sponsors.
Timing also matters. Marketing agencies in DC structure annual plans around budget cycles, RFI and RFP calendars, and program milestones. Integrated campaigns are staged to seed narratives before market research begins, then activate demand as budgets lock and acquisition paths solidify. This orchestration aligns brand, demand, and field tactics to how government actually buys.
Check out our work with Aechelon
Compliant creativity without compromise
Government buyers have stringent expectations for accuracy, accessibility, and privacy. The best marketing agencies in Washington DC create bold ideas inside those guardrails. They balance messaging consistency with the nuance needed for different agencies, roles, and mission sets. They ensure claims are verifiable, creative is compliant, and assets meet accessibility standards, all while keeping a strong and differentiated brand voice.
This discipline enables creative work that stands out in crowded categories like cybersecurity, cloud, data, and digital services. Marketing agencies based in DC use storytelling frameworks that connect technology to outcomes such as operational readiness, resilience, and citizen trust. The result is work that resonates in briefings and on procurement portals alike.
Data-driven targeting and ABM for public sector
Account-based marketing is essential in government. With a finite set of priority agencies and programs, DC-based marketing agencies support their clients by using account intelligence to focus resources where they will land the highest impact. They map decision units, surface intent signals, and personalize outreach by role and stage in the buying cycle.
From target lists to buyer journeys
- Define an Ideal Agency Profile and a priority list of programs and sub-agencies.
- Identify contracting paths and relevant partners to shape teaming strategies.
- Map influencers and evaluators across mission, IT, security, legal, and procurement.
- Build journey paths that mirror research, evaluation, and acquisition phases.
- Activate channel mixes that include thought leadership, analyst relations, events, sales enablement, and targeted media.
To maintain relevance, marketing agencies in Washington DC refresh account insights quarterly. They integrate data from events, webinars, social engagement, and site analytics to refine creative and offers. This closed-loop approach keeps programs efficient and outcomes measurable.
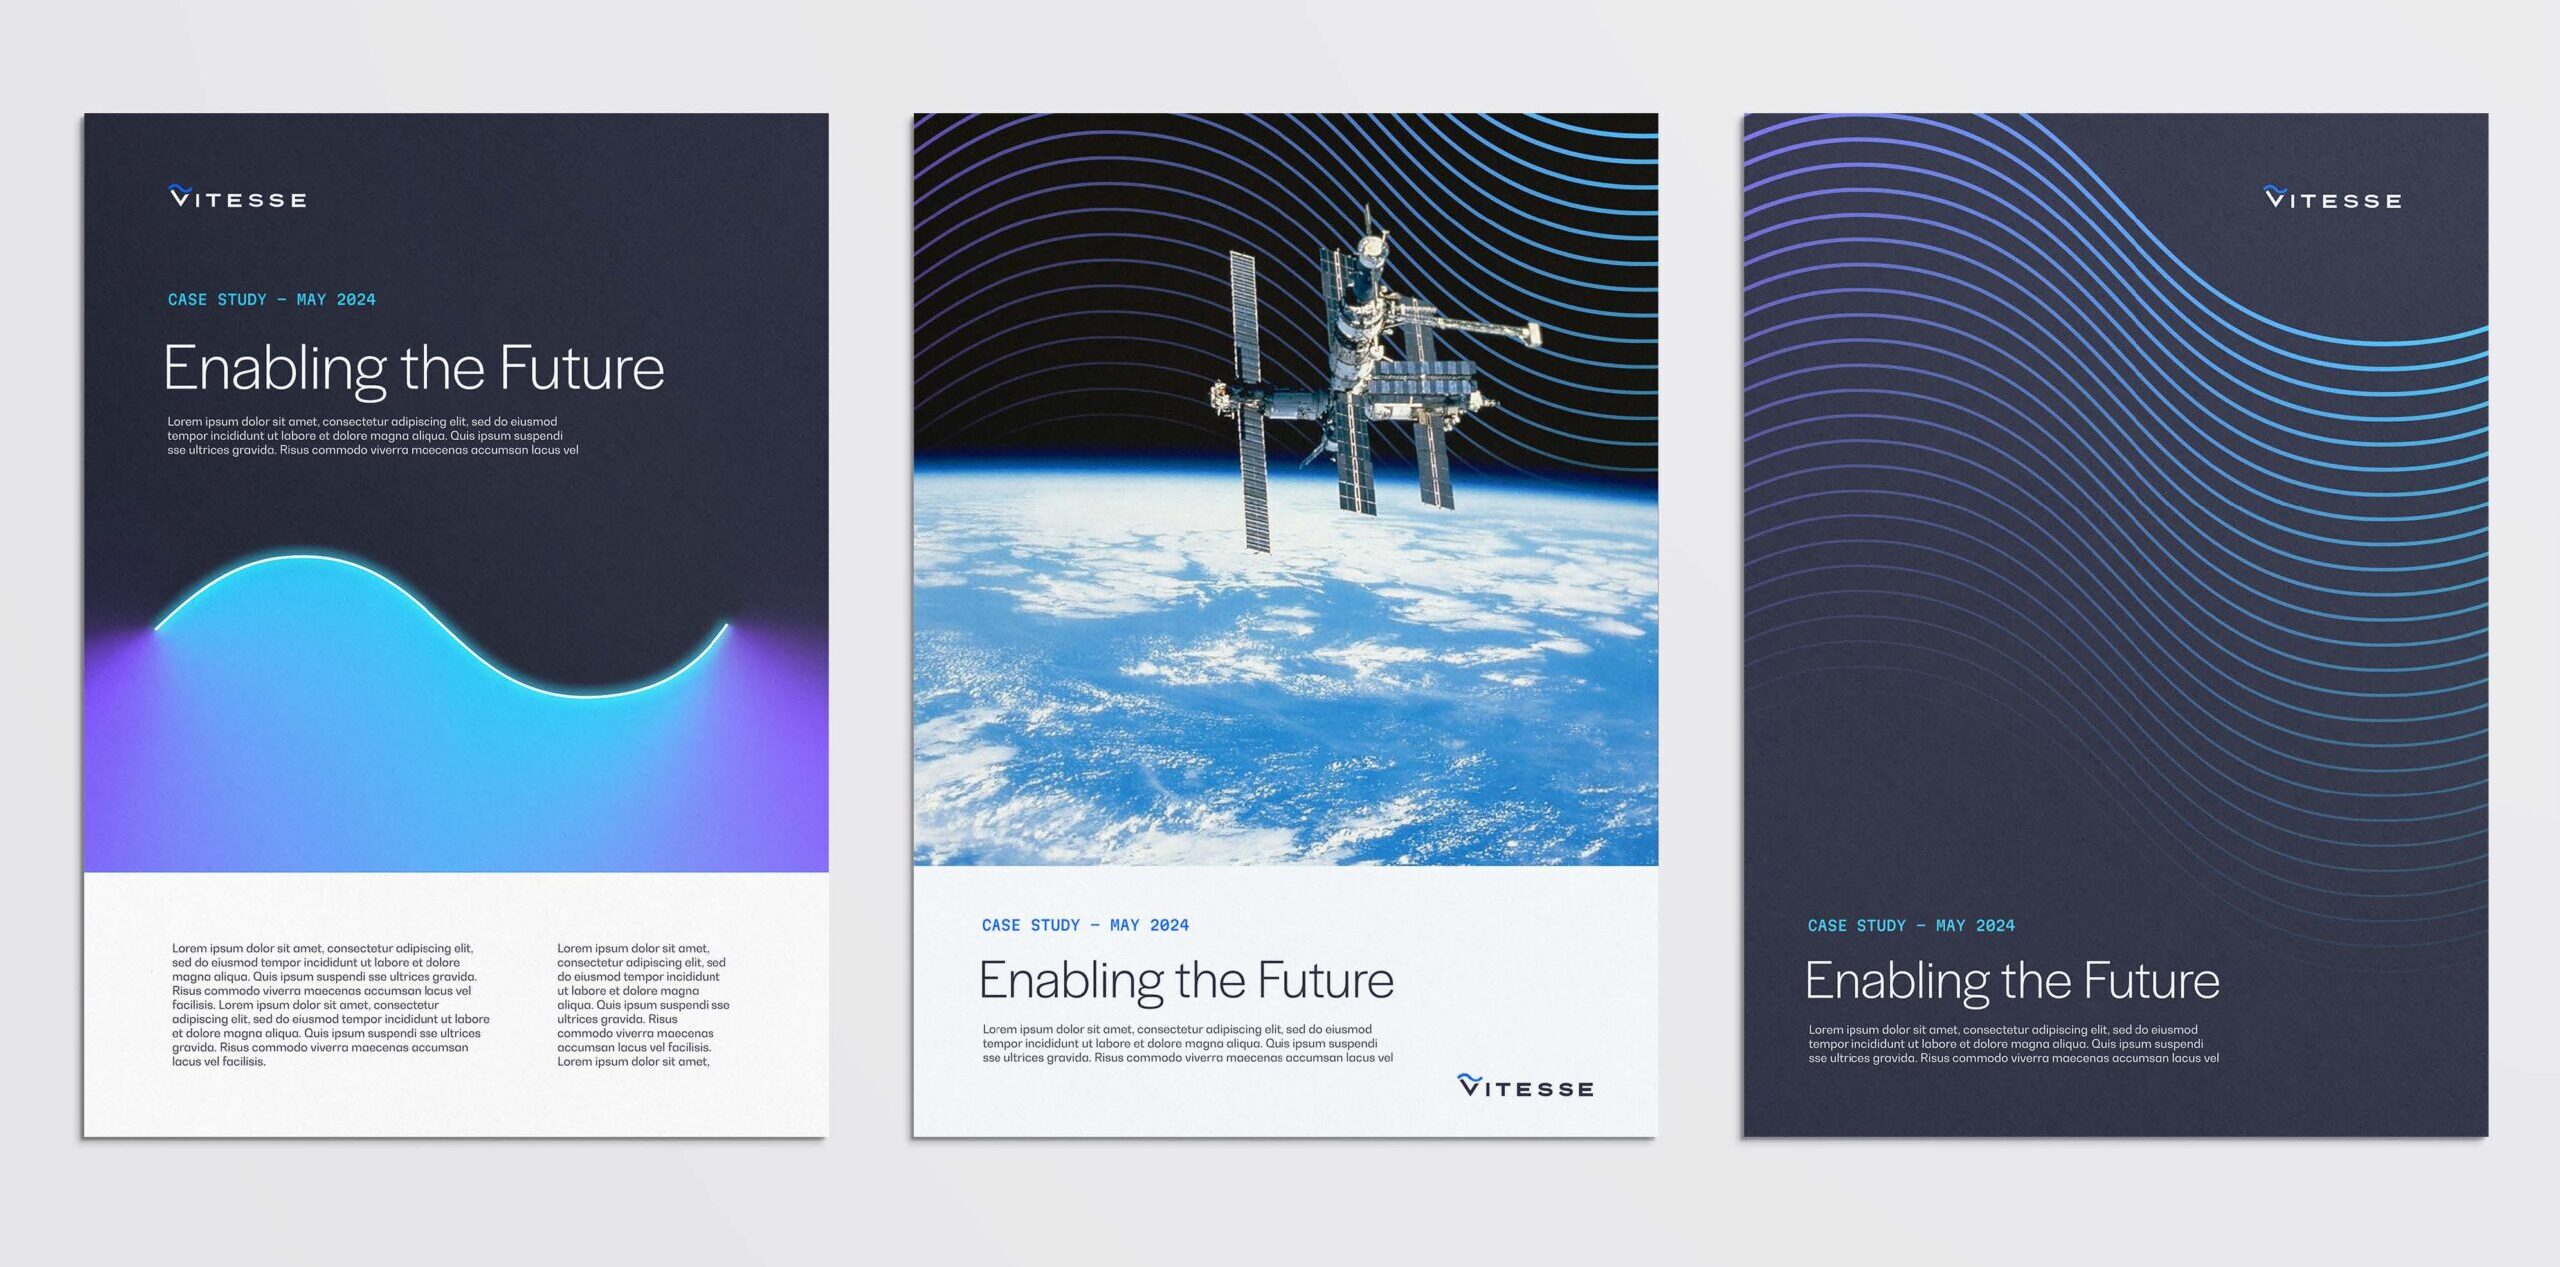
Check out our work with Vitesse Systems
Content and thought leadership that moves the needle
In B2G, content is a trust engine. The strongest marketing agencies in Washington DC build editorial programs that elevate a company’s point of view on policy and mission topics while demonstrating technical depth. Executive briefs, issue primers, solution playbooks, and ROI calculators work as a system to educate buyers and equip capture teams.
Distribution is curated, not broad. A strong marketing agency partner will place content in channels where program managers and contracting officers already spend time. They prioritize association partnerships, targeted newsletters, public sector communities, and earned media over indiscriminate reach. This precision maximizes credibility and reduces waste.
Websites and digital experience built for government buyers
Public sector prospects demand clarity. The best marketing agencies in Washington DC design websites that make it easy to find contract vehicles, compliance credentials, data sheets, and mission-specific solutions. Performance and accessibility are table stakes. Navigation and content architecture reflect how agencies search, not how companies are organized internally.
Conversion strategy matters as much as user experience. Marketing agencies should aim to use tailored calls to action for demos within secure environments, technical briefings, capture team requests, or on-demand webinars. They should also measure engagement by role, agency, and account to inform sales prioritization and nurture design. Accessibility and performance best practices should be treated as differentiators, not afterthoughts.
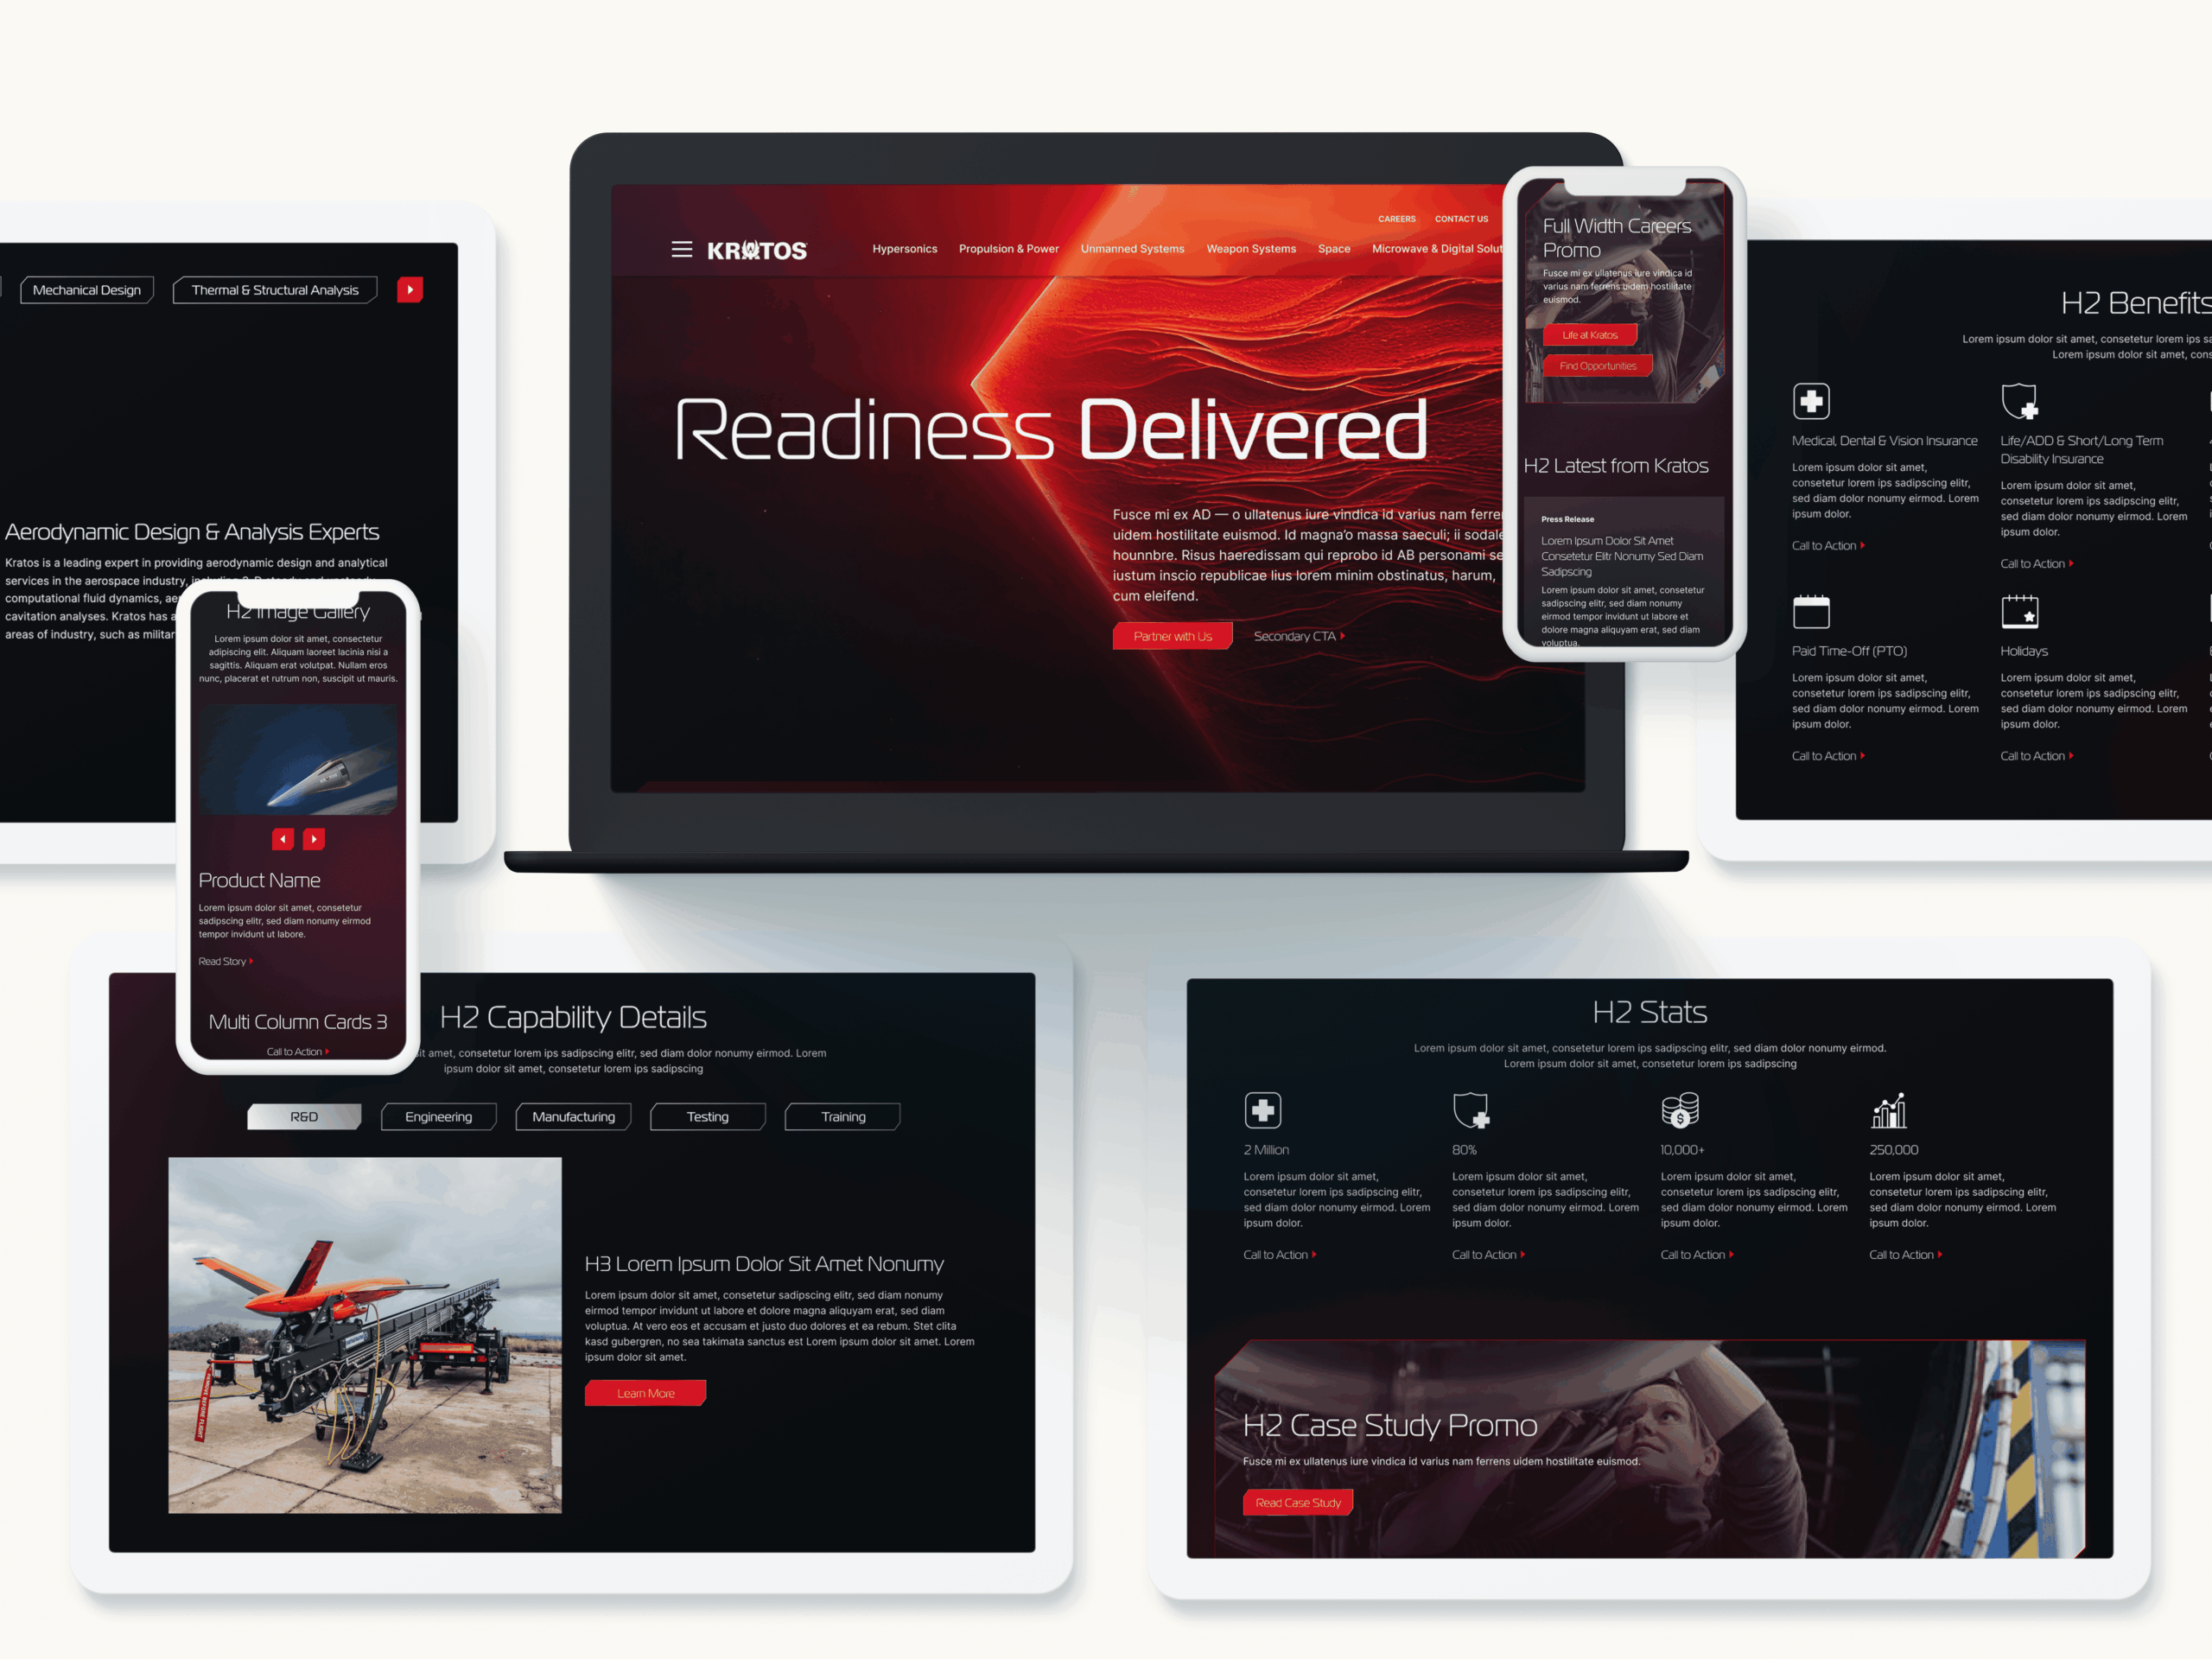
Check out our work with Kratos
SEO and intent capture for public sector buyers
Search is a primary research tool for government evaluators. Top marketing agencies in Washington DC build SEO strategies around mission-aligned keywords, procurement terms, and compliance queries. They optimize solution pages, partner content, and structured data to capture high-intent traffic from federal and state buyers who are already evaluating options.
Technical excellence underpins findability. From schema to page speed to secure hosting, marketing agencies in Washington DC ensure sites are engineered for visibility and trust. When it is time to scale organic growth, partnering on search engine optimization unlocks compounding returns that lower cost per opportunity while increasing pipeline quality.
Events and field marketing aligned to the Beltway calendar
Industry events remain critical for discovery and relationship building. Marketing agencies in Washington DC plan roadmaps around cornerstone conferences, agency days, and Hill briefings. They integrate event moments into broader campaigns with pre-event thought leadership, in-booth activations, invite-only roundtables, and post-event follow-ups that reflect what buyers actually discussed in the room.
Measurement and attribution across long buying cycles
Attribution is complex when cycles span quarters or years. The leading marketing agencies in Washington DC design measurement frameworks that blend account engagement, capture team feedback, and revenue outcomes. They build models that recognize the role of upper-funnel influence in pipeline creation and the importance of persistence through downselect.
Operationally, marketing agencies in Washington DC align KPIs to the business question at hand. Brand programs are judged on reach and resonance in priority agencies. Demand programs are measured on account-level engagement, meeting creation, and qualified pipeline. Both roll up to revenue, but are optimized differently to avoid false tradeoffs.
How to evaluate a B2G agency partner
Choosing the right partner influences everything from win rates to the credibility of your message. The most reliable marketing agencies in Washington DC combine creative excellence with Beltway literacy and operational rigor. Ask for examples of work that moved the needle in programs similar to yours and look for teams that bring both strategists and doers to the table.
- Sector fluency: Can the agency articulate emerging priorities in your target programs and agencies?
- Proof of performance: Do they have case studies with measurable impact in public sector campaigns?
- Compliance confidence: Are accessibility, claims substantiation, and privacy integrated into their process?
- Sales alignment: How do they enable capture, channel, and partner teams to extend campaign momentum?
- Measurement maturity: Can they build attribution models that reflect your buying cycle?
If you need a partner that already speaks the language of the mission, review Bluetext’s public sector work and perspective on why federal marketing matters.
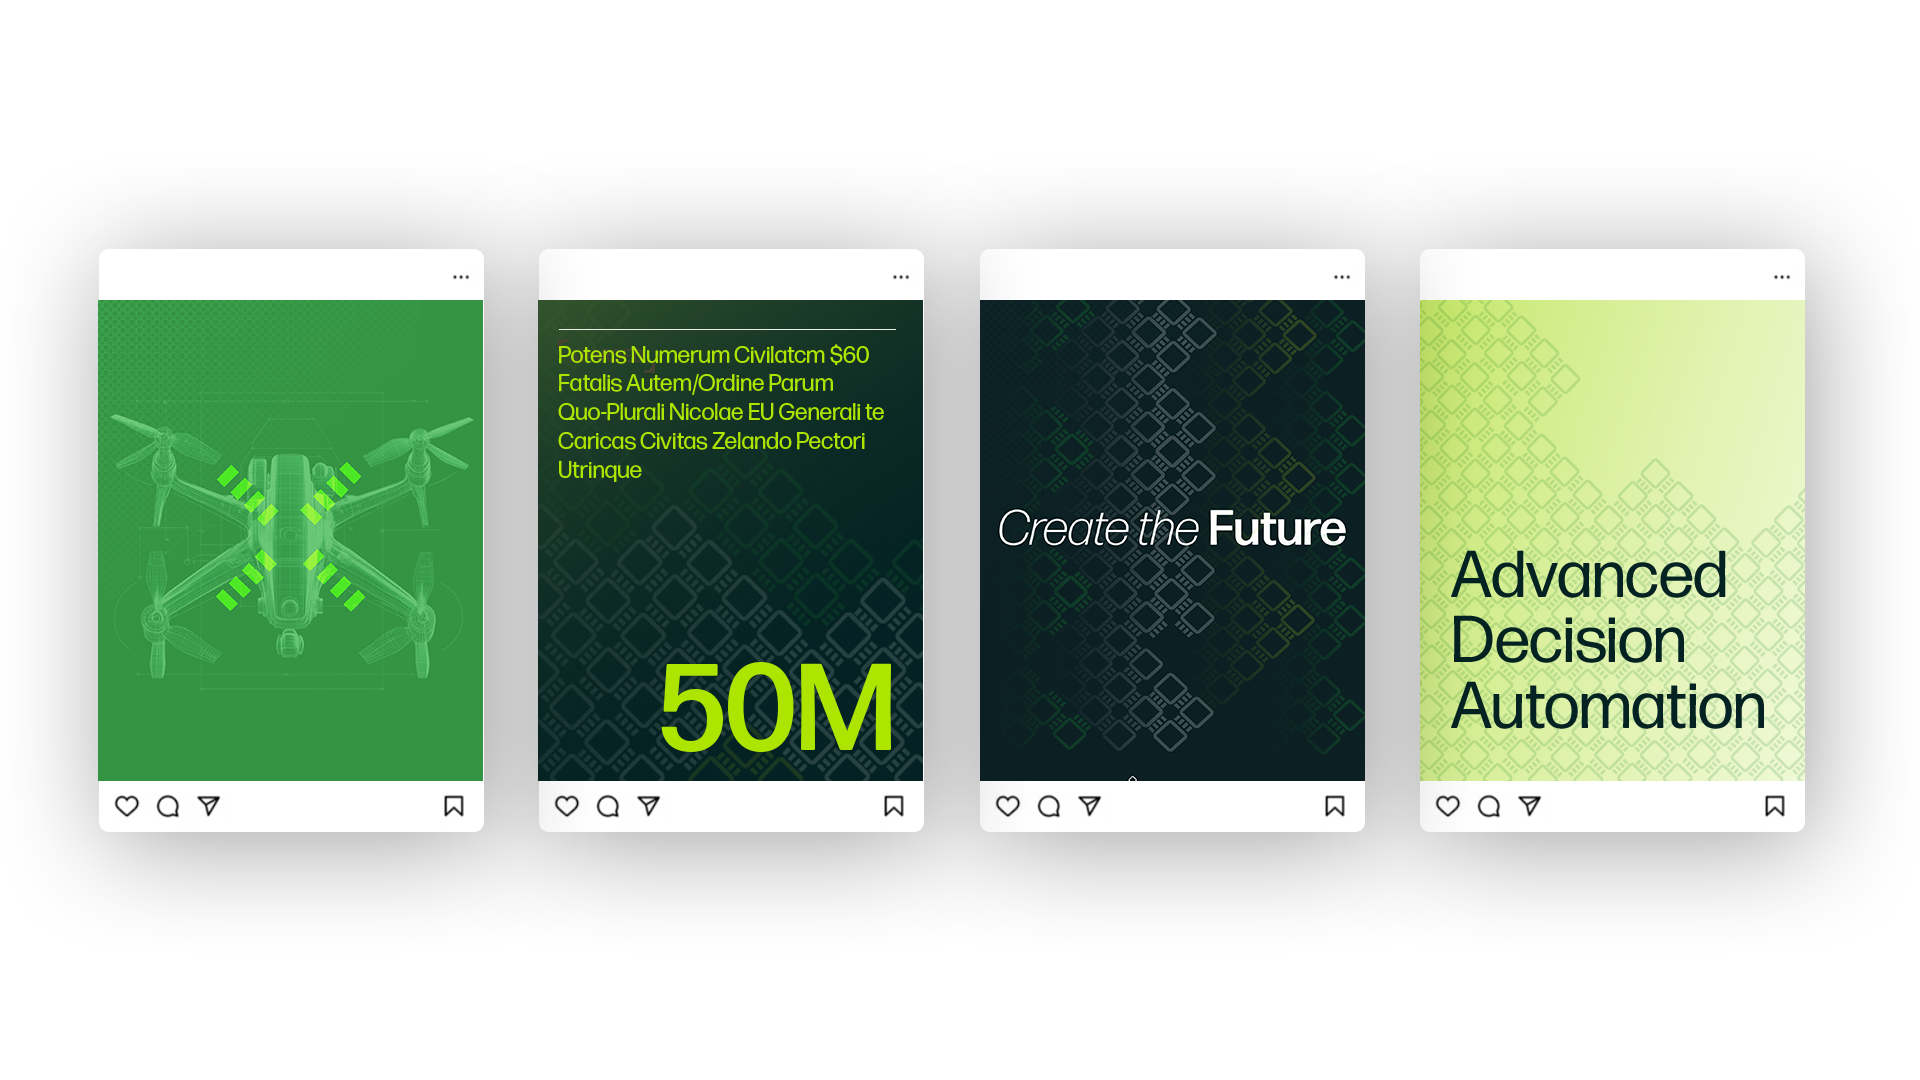
Check out our work with Camgian
Partner ecosystems and routes to contract
Routes to market in B2G are rarely linear. The most effective marketing agencies in Washington DC support co-marketing with primes, ISVs, and channel partners to expand reach and qualify deals. They build campaign narratives that make teaming value explicit and help sales navigate partner-influenced capture and subcontracting strategies.
Programmatically, marketing agencies in Washington DC create enablement kits that include joint messaging, campaign-in-a-box assets, and event packages. They equip clients to carry their story into accounts where they already have credibility, which shortens sales cycles and increases probability of win.
Creative that respects the mission and the audience
Government audiences are inundated with noise. The strongest marketing agencies in Washington DC build brand systems that communicate relevance quickly. Visual identity, motion, and copy should reflect the seriousness of the mission while showcasing what is distinct about your approach. This balance is essential for categories where features look similar and incumbency is strong.
Campaigns work hardest when creative aligns with the buying stage. Middle-funnel assets like solution briefs and demonstration videos are crucial for technical evaluators, while outcome narratives and ROI frameworks resonate with executive sponsors. Marketing agencies in DC plan creative by persona and journey stage to ensure every touchpoint has a clear job to do.
AI, analytics, and the next wave of B2G innovation
AI-driven analytics are reshaping account intelligence, content creation, and media optimization. The most progressive marketing agencies in Washington DC use AI to identify emerging intent signals, generate first drafts for specialized content, localize assets for state and municipal audiences, and improve channel mix decisions. They do this within strict governance to protect privacy and uphold accessibility.
As missions evolve across cybersecurity, data interoperability, and digital service delivery, marketing agencies in Washington DC will continue to lead in crafting messages that bridge policy and technology. If your roadmap includes advanced capabilities and complex change management, working with B2G specialists raises your odds of adoption.
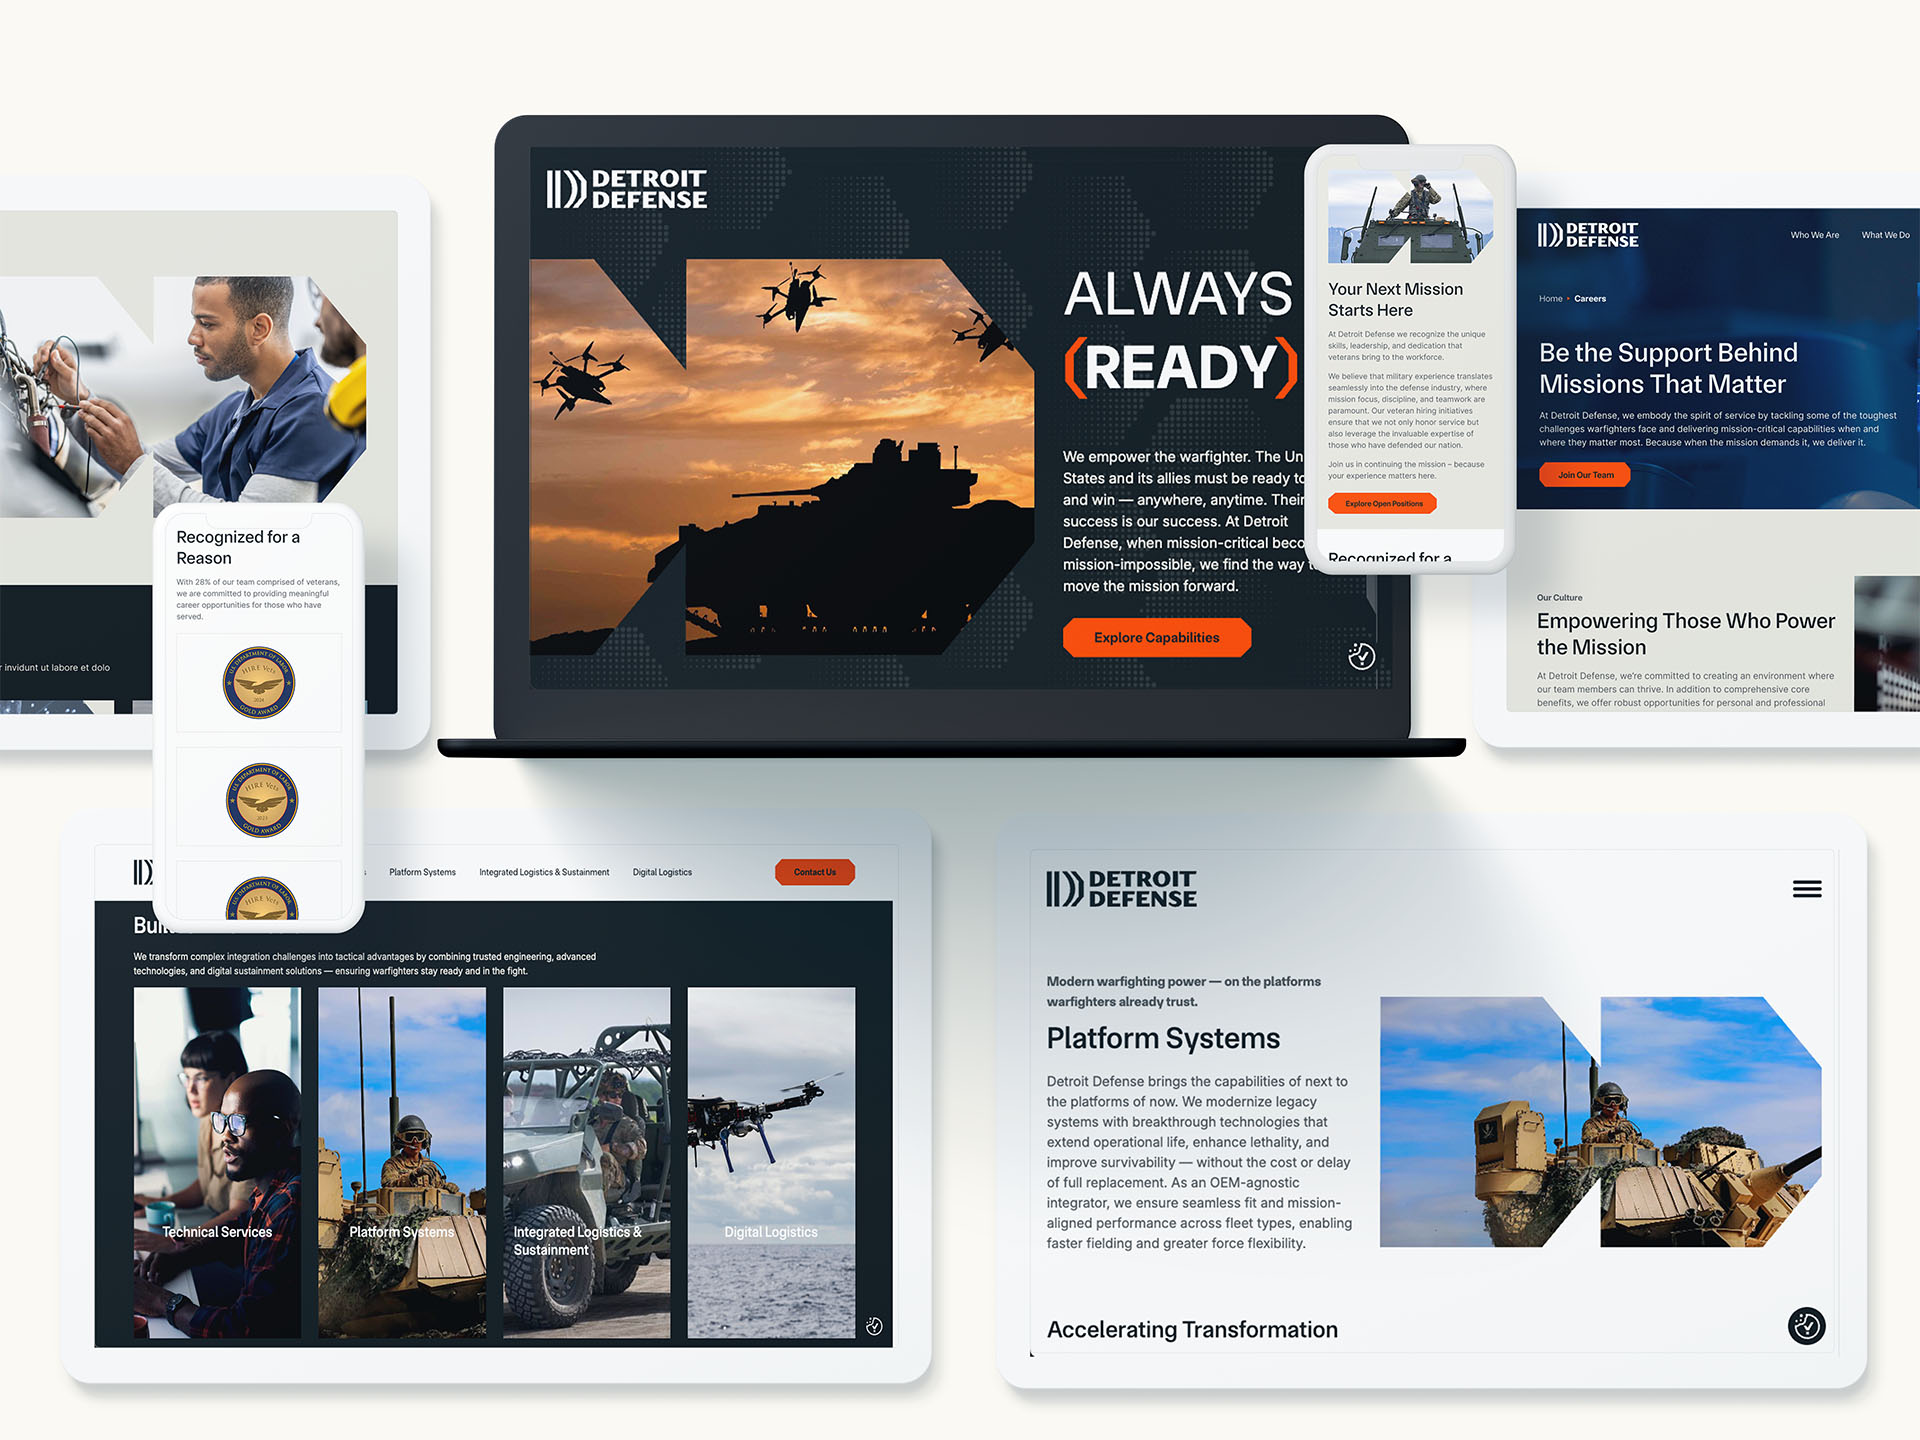
Check out our work with Detroit Defense
Practical steps to get started
If you are entering or expanding in the public sector, begin with a focused plan. We recommend starting with three elements: a priority agency and program list, a message architecture tied to mission outcomes, and a 90-day campaign MVP that stress-tests channels and content. These inputs give you data to refine the model before committing to a broader rollout.
- Document your Ideal Agency Profile and target programs.
- Build a messaging framework aligned to policy and procurement drivers.
- Map buyer journeys by role and stage, including capture and partner touchpoints.
- Stand up a pilot campaign to validate channels and offers.
- Scale with a governance model that keeps accessibility and compliance central.
As you scale, a DC-based marketing agency can help align sales enablement, partner engagement, and measurement to the operating rhythm of your capture teams. With this alignment in place, marketing becomes a direct contributor to win strategy.
Why Bluetext
Bluetext is built for organizations that need to influence government buyers with clarity and credibility. Our team pairs creative excellence with public sector fluency and operational rigor. We design programs that resonate at the mission level, scale across partners, and roll up to measurable revenue impact.
From brand strategy and digital experience to ABM and performance media, we help companies turn complexity into momentum. Our process is collaborative, data-driven, and built to deliver progress your executive team can see in pipeline and awards.
Take the next step
Government buyers expect rigor, and the right strategy can elevate your message from noise to necessity. If you are ready to accelerate growth with a partner who lives at the intersection of policy and performance, connect with Bluetext. Our team will assess your current state, prioritize opportunities, and design a plan to win in the public sector. Contact us today and see why companies choose Bluetext to drive innovation, credibility, and measurable outcomes across the B2G landscape.
In B2B marketing, subject matter experts (SMEs) are a company’s hidden superpower. Their expertise can position your brand as an authority, but without visibility, insight alone rarely moves the needle. That’s where LinkedIn Paid campaigns come in. By strategically amplifying SMEs’ content, organizations can turn thought leadership into a measurable engine for demand generation, simultaneously building brand authority and generating qualified leads.
The key is balance: authentic, insightful content combined with paid amplification ensures SMEs are seen by the right audience at the right time, without losing credibility or sounding overtly promotional.
Identifying the Right Subject Matter Experts for Amplification
Not every internal expert is naturally suited to public-facing thought leadership. Effective SMEs for LinkedIn campaigns typically:
- Possess deep industry knowledge relevant to your target audience
- Communicate clearly and persuasively in written or video formats
- Are enthusiastic about sharing insights externally
Aligning SMEs with both business goals and audience personas ensures their content addresses real pain points and resonates with potential buyers. Additionally, internal processes for content approval and compliance should be defined upfront to maintain consistency and brand integrity.
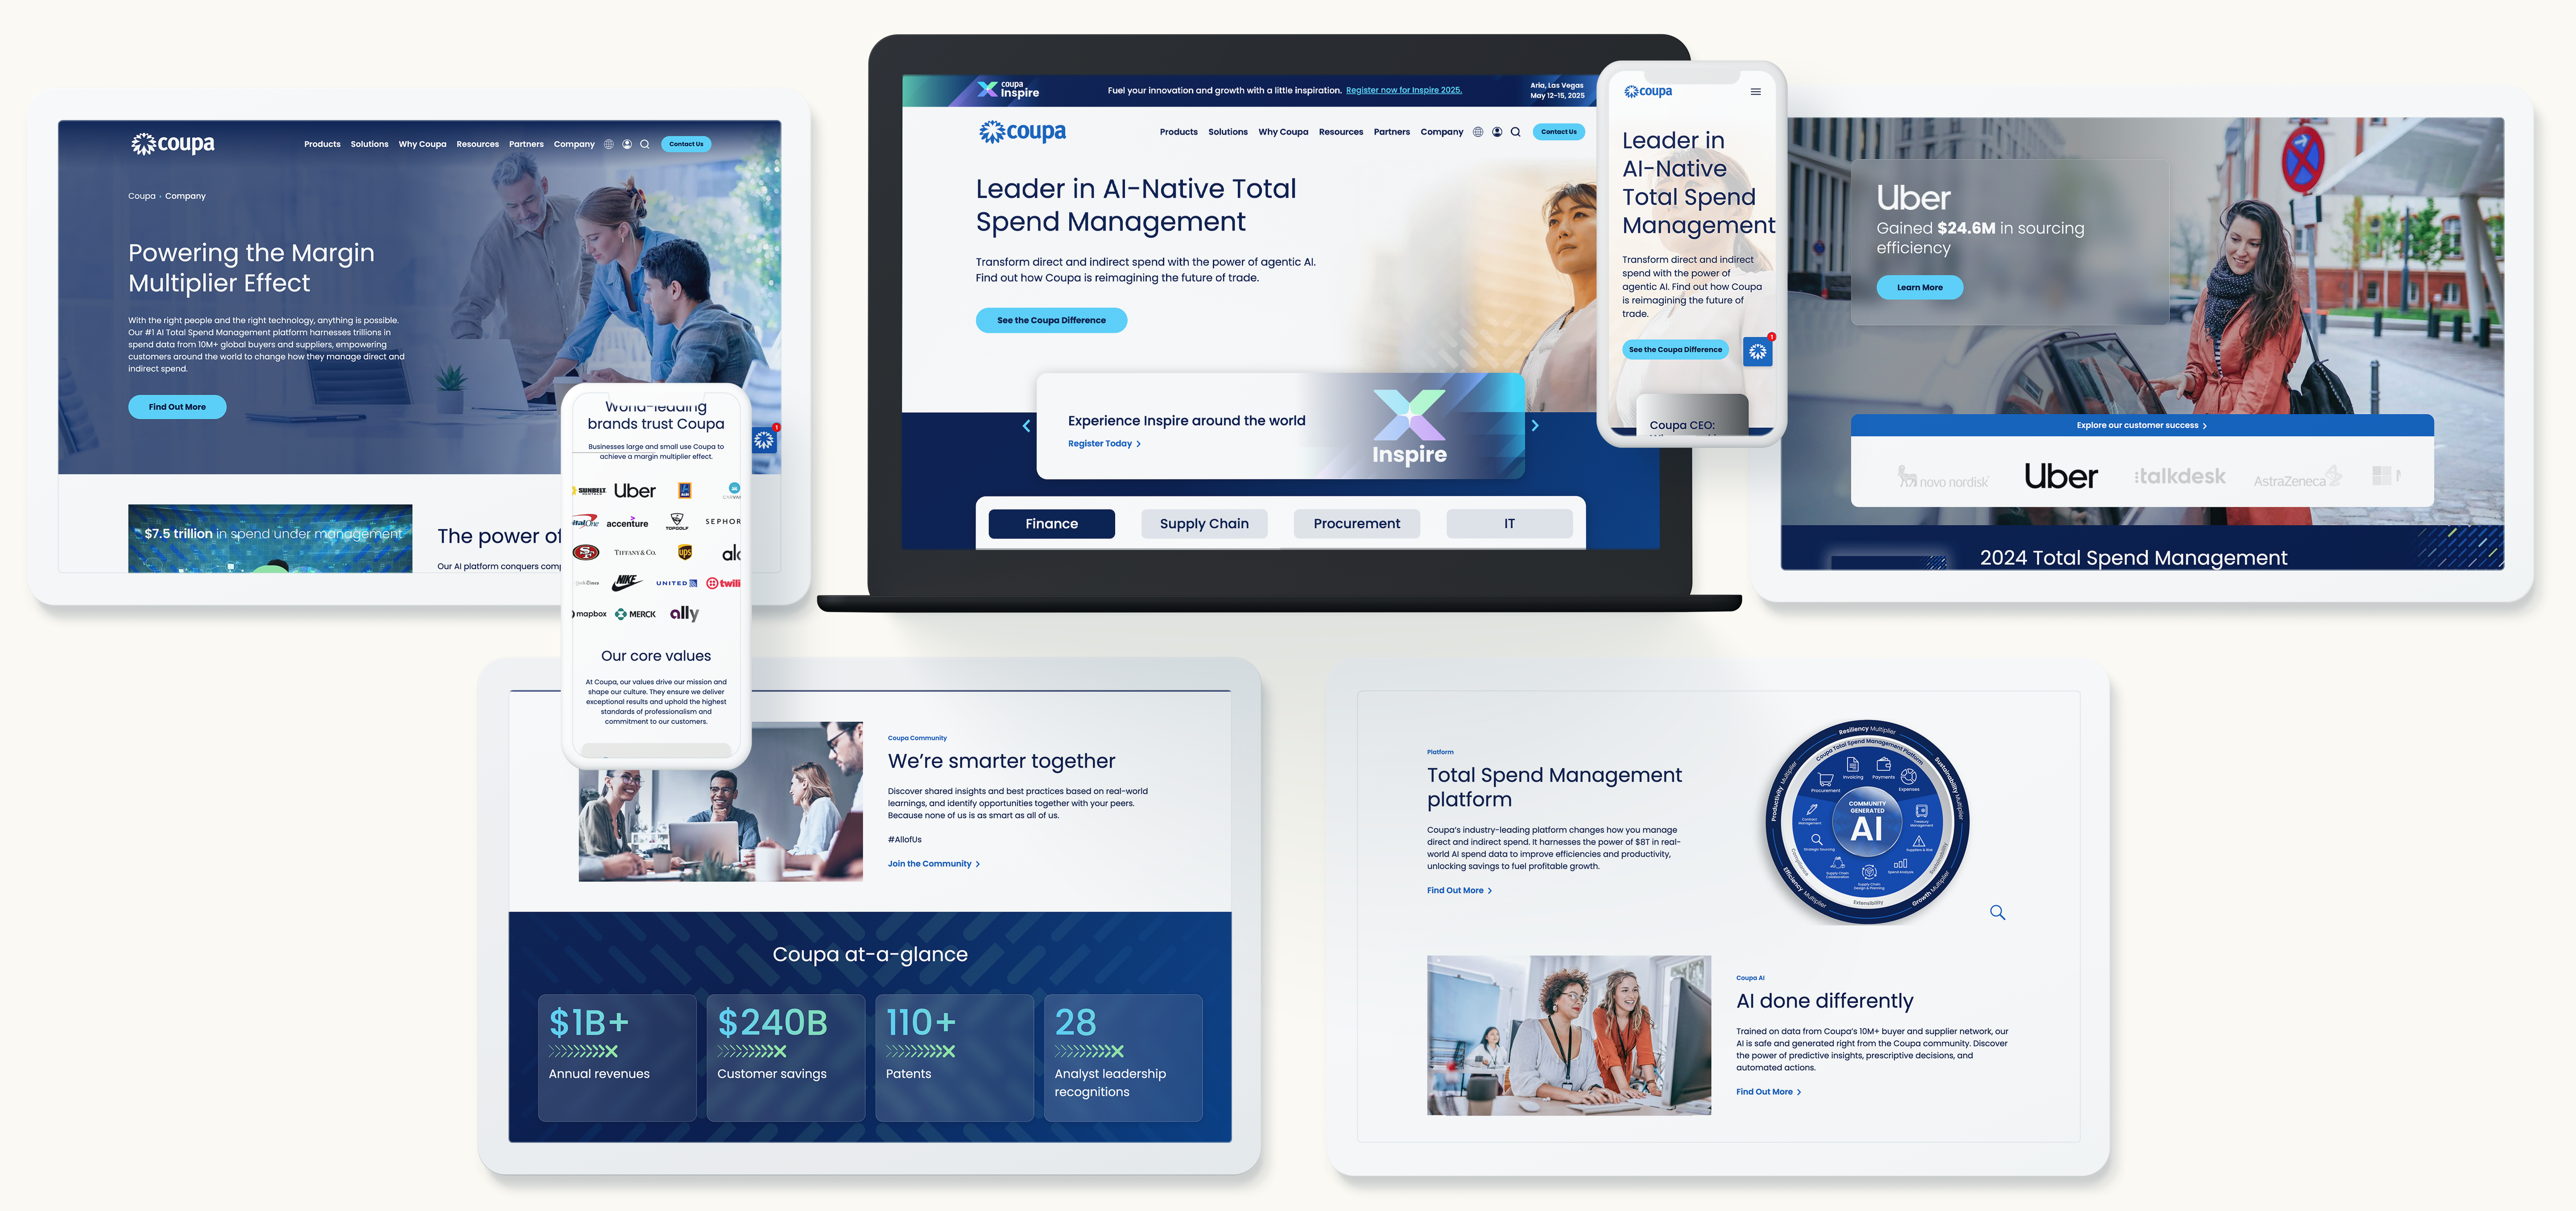
Crafting Content That Resonates on LinkedIn
The most successful LinkedIn campaigns start with content that is:
- Insightful and actionable: Industry trends, lessons learned, or innovative solutions
- Visually engaging: Slide decks, infographics, and carousel posts
- Digestible: Short, well-structured posts or video snippets for busy professionals
Repurposing internal expertise into formats optimized for LinkedIn engagement helps SMEs reach audiences efficiently while establishing authority. For instance, a technical expert can transform a complex whitepaper into a concise slide deck that highlights key takeaways for decision-makers.
Designing Paid LinkedIn Campaigns for Maximum Impact
Paid campaigns allow marketers to extend the reach of SME content beyond organic followers. Key components include:
Audience Segmentation
Targeting should be precise: decision-makers, industry peers, and relevant professional groups. Use LinkedIn filters such as role, seniority, company size, and industry to ensure content reaches the right people.
Campaign Objectives
- Awareness: Boost SME visibility and brand credibility
- Engagement: Encourage likes, comments, shares, and content interactions
- Conversion: Capture leads through webinar registrations, downloads, or demo requests
Budget and Bidding Strategy
Start with modest budgets to test performance, then scale successful campaigns. LinkedIn offers bidding options optimized for engagement or lead generation depending on your objectives.
Ad Creative Tips
- Showcase the authentic voice of the SME
- Include a clear call-to-action linking to gated content or lead capture forms
- Use compelling visuals, charts, or infographics to reinforce authority
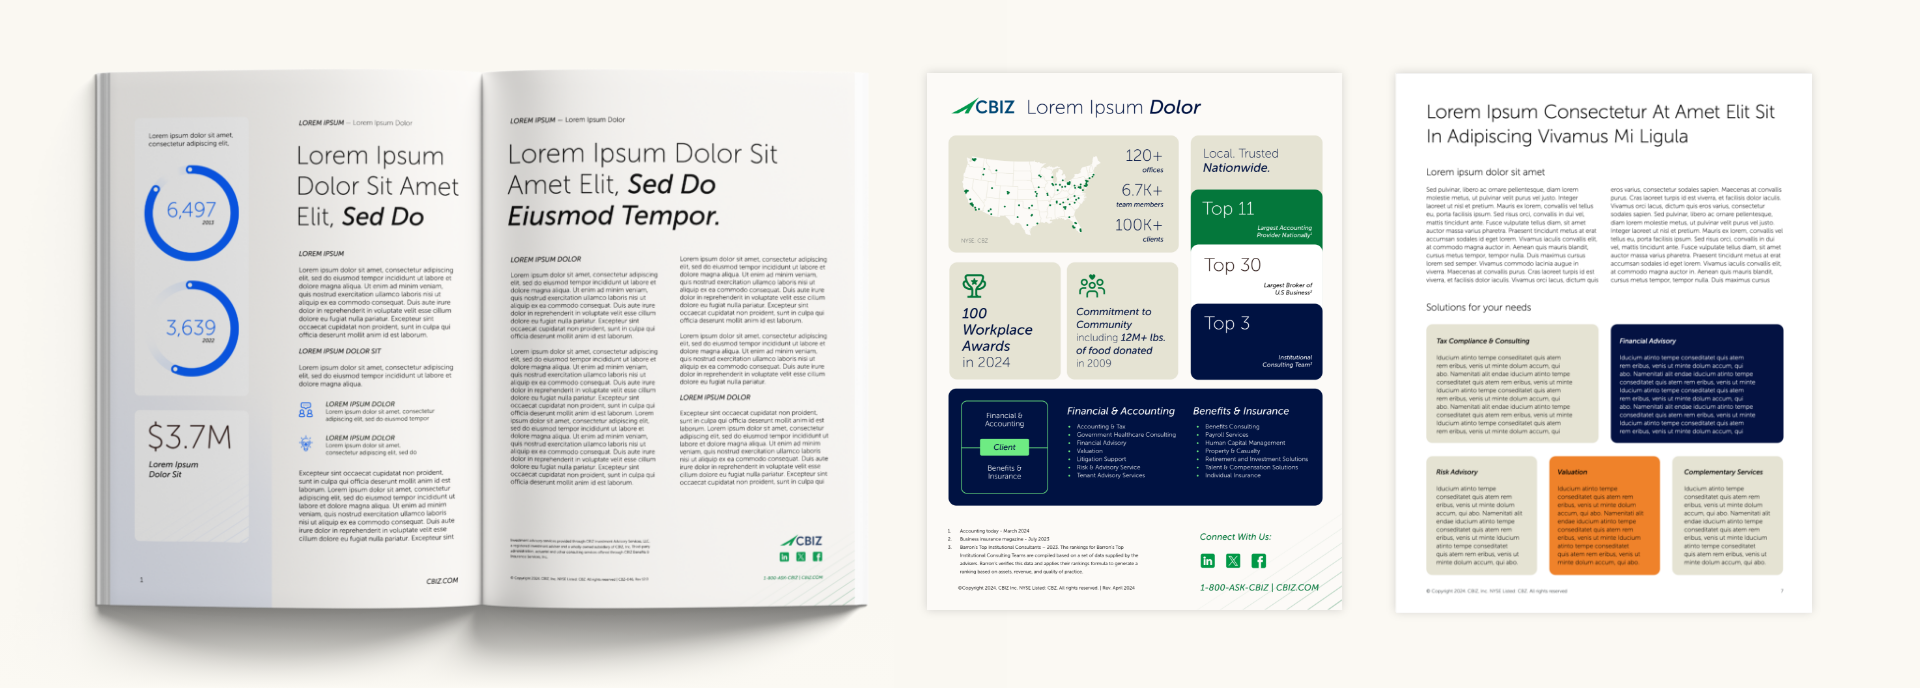
Measuring Success: From Authority to Pipeline
To ensure SMEs drive tangible business results, track both brand authority and demand metrics:
- Thought leadership metrics: Post views, likes, shares, and comments
- Demand generation metrics: Click-throughs, webinar registrations, form fills, and ultimately qualified leads
Setting up conversion tracking between LinkedIn campaigns and your CRM allows teams to quantify ROI and refine strategies based on what drives engagement and pipeline growth.
Optimizing and Scaling SME Campaigns
Continuous improvement ensures long-term impact:
- A/B test different content types, messaging angles, and ad formats
- Use retargeting to nurture previously engaged audiences
- Expand campaigns to additional SMEs or regional markets while maintaining authenticity
Scaling requires consistency: every SME’s voice should align with brand messaging while reflecting their unique expertise.
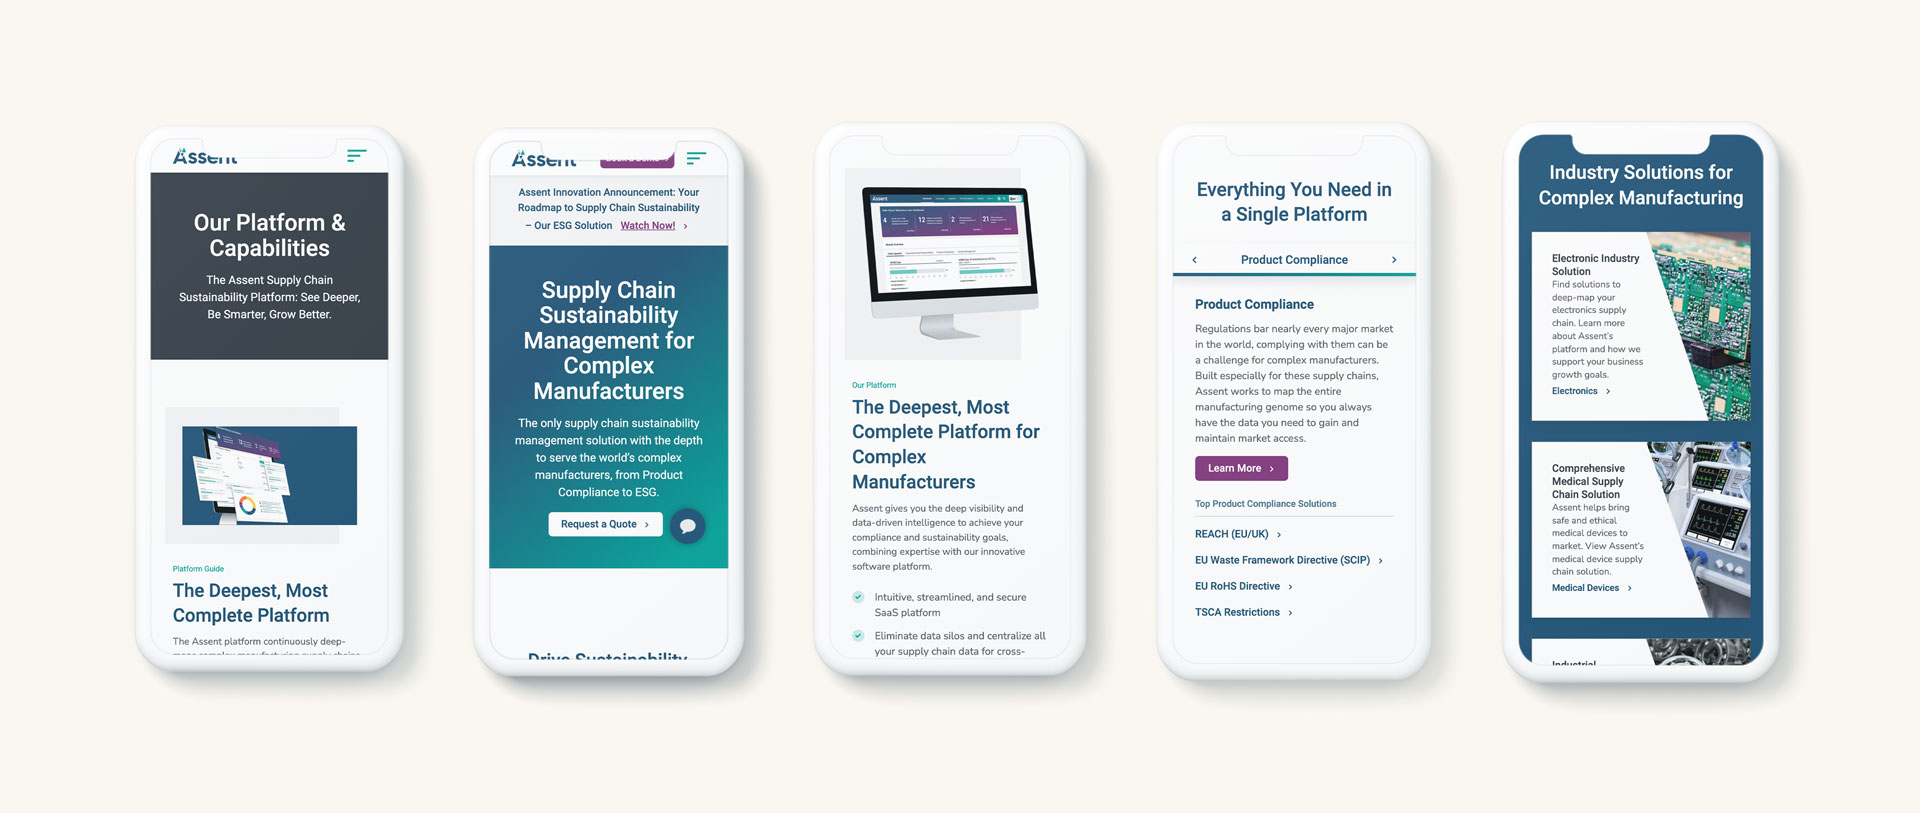
Best Practices and Compliance
Effective campaigns adhere to professional and ethical standards:
- Follow LinkedIn content guidelines and industry regulations
- Ensure SME messaging aligns with brand voice and approvals
- Avoid over-promotion; focus on insight and thought leadership to maintain credibility
Unlocking the Full Potential of LinkedIn Paid for Thought Leaders
When executed strategically, paid LinkedIn campaigns transform internal SMEs from quiet experts into demand-generating engines. Coordinated campaigns deliver:
- Brand authority: Positioning your organization as a leader in your field
- Pipeline growth: Driving engagement, leads, and conversions
Bluetext helps B2B marketers amplify their experts on LinkedIn to drive both authority and pipeline. Contact us to transform your thought leaders into demand engines.
For decades, search engine optimization (SEO) has been the cornerstone of digital visibility. Brands climbed the SERP ladder by fine-tuning keywords, metadata, backlinks, and technical performance. But as we enter a new era of information retrieval, one thing is clear: search is no longer just about search engines—it’s about AI.
From ChatGPT to Gemini, Claude to Perplexity, Large Language Models (LLMs) now answer millions of queries daily. Users aren’t clicking links—they’re receiving summaries. For marketers and content creators, that’s both a threat and an opportunity. The new challenge? Becoming the source behind the AI answer.
Enter LLMO and AEO—two game-changing approaches to digital strategy that help ensure your content surfaces in this AI-first discovery landscape.
What Is LLMO? Understanding Large Language Model Optimization
LLMO stands for Large Language Model Optimization—the practice of crafting content that LLMs can read, understand, trust, and surface in generated outputs. Unlike traditional SEO, which optimizes for web crawlers like Googlebot, LLMO focuses on the way AI models digest and regenerate language.
LLMs don’t operate like search engines. They don’t “rank” content by authority alone. Instead, they:
- Interpret semantic meaning
- Generate answers based on contextual reliability
- Use natural language understanding to surface the most helpful response
- Rely on internal training data and real-time search tools to cite sources
If your content isn’t readable, factual, and structured in a way that an LLM can parse, your brand may never make it into the answer—even if you’re ranked #1 on Google.

What Is AEO? Introducing Generative Engine Optimization
Answer Engine Optimization (AEO) is the practice of optimizing for AI-based search engines and conversational platforms. Think of it as the evolution of SEO, reimagined for tools like:
- Perplexity (which cites sources in responses)
- You.com
- ChatGPT with browsing
- Google SGE (Search Generative Experience)
Where SEO is about being ranked, AEO is about being referenced.
These AI engines often quote, link to, or paraphrase content. AEO helps ensure your brand’s content is:
- Discoverable by AI crawlers and retrievers
- Structured for AI citation and reference
- Trusted as a reliable source by generative algorithms
Together, LLMO and AEO form a dual-layered strategy for the future of digital visibility.
Why LLMO and AEO Matter More Than Ever
The Decline of the Click
We’ve entered the zero-click era, where generative answers mean users don’t need to click through to your website. This has profound implications:
- Organic CTRs (click-through rates) are falling
- Even top-ranking pages see fewer visits
- Users trust AI-summarized answers more than traditional snippets
The Rise of AI-Mediated Discovery
Increasingly, business leaders, researchers, and consumers are turning to LLMs for fast, conversational insight. For B2B brands especially, being included in the answer is the new mark of authority.
Visibility ≠ Ranking
It’s possible to rank #1 on Google and be ignored by generative tools—or to rank nowhere and still be quoted in ChatGPT. AEO is how you bridge that gap.

How LLMs Consume and Cite Content
To optimize for LLMs, we need to understand how they work:
- LLMs prefer clear, authoritative content with natural language flow
- They extract structured insights—especially from lists, FAQs, and headers
- They trust brands with high topical authority (frequent mentions, consistency, backlinking)
In short, LLMs reward what humans also value: clarity, expertise, and relevance. But unlike humans, they need structure and signals to understand your content’s reliability.
Core Tactics for LLMO and AEO Success
1. Create Conversational, Contextual Content
LLMs are trained on how people speak. That means:
- Write naturally, not robotically
- Use FAQs, how-tos, and question-answer formats
- Answer specific queries in plain, clear language
- Incorporate synonyms, related phrases, and user intent
Example: Instead of “Answer Engine Optimization for B2B SEO,” try “How can B2B marketers optimize their content to appear in AI-generated answers?”
2. Focus on Semantic & Long-Tail Keywords
Traditional keyword stuffing doesn’t work in LLM land. Instead:
- Emphasize search intent over search volume
- Use long-tail queries that mimic how people speak to AI
- Include variations of core terms to build contextual weight
AEO-optimized keywords:
“Cited by ChatGPT,” “content that appears in Perplexity AI,” “optimize for AI search results,” “LLMO strategy for marketing teams.”
3. Structure Content for Machine Interpretation
Just like search engines love schema, so do LLMs. Your formatting matters:
- Use clear H1, H2, H3 structure
- Break up walls of text with bullets and numbered lists
- Use tables, charts, and bolded terms for scannability
- Add schema markup (FAQPage, HowTo, Article) to signal intent
Tools like Perplexity often favor clearly segmented guides over narrative-only blog posts.
4. Build Depth, Authority, and Relevance
LLMs reference content that feels complete and authoritative. That means:
- Go deep—1,500+ words often outperform thin content
- Back up points with data, quotes, and examples
- Demonstrate topical consistency across your site (e.g., multiple blogs on LLMO, AEO, AI content strategy)
Your brand needs to sound like and act like an expert.
5. Optimize Metadata & Internal Links
AI tools ingest metadata. Be intentional:
- Write natural-language meta titles and descriptions
- Use internal links to cluster related content and establish authority on a topic
- Include descriptive anchor text (e.g., “see our guide to AI-ready content”)
This not only helps traditional SEO—it gives AI models contextual signals that elevate your visibility.
6. Citations, Mentions & External Signals
Generative models often cite based on frequency and trust. You can increase your chances by:
- Earning backlinks from high-authority sites
- Using original statistics or frameworks worth referencing
- Publishing on reputable third-party platforms (e.g., Medium, Substack, LinkedIn)
Pro Tip: AI models love linking to well-structured thought leadership—especially if it includes unique data, expert commentary, or industry frameworks.
7. Monitor Your AI Visibility
You can’t improve what you don’t measure. Use tools to:
- Search your brand in ChatGPT, Gemini, and Perplexity
- Look for citations, summaries, or paraphrased answers
- Track whether your domain is being pulled in AI overviews
As this space evolves, visibility in generative search may become a key digital marketing KPI.
What LLMO + AEO Mean for Marketers
SEO isn’t dead—but it’s evolving. Marketing teams who embrace LLMO and AEO will:
- Increase their AI-era visibility
- Reduce dependency on traditional SERPs
- Future-proof their content investments
- Position their brand as an authoritative, AI-trusted resource
In short, it’s not enough to be seen. You need to be cited. Trusted. Used.
Let’s Talk About Your AI Visibility
At Bluetext, we help brands thrive in the age of AI search. From content strategy to metadata, structure, and authority-building, we craft marketing that performs across platforms—including the ones without a click-through.
Reach out today to ensure your content gets seen, cited, and surfaced—wherever your audiences are searching.
It’s easy to think of brand reputation as something soft—sentiment, social buzz, or how people feel about your name. But in today’s marketing environment, reputation isn’t just perception. It’s infrastructure.
With the rise of AI-driven tools and generative search engines, your brand’s reputation isn’t just being observed—it’s being modeled. The language used to describe you, the consistency of your message, and the credibility of the sites linking back to you are all shaping how search engines and AI systems categorize and recall your business.
This isn’t about visibility in the traditional sense. It’s about structural presence—your reputation layer—the ambient signals that define your brand online, whether you control them or not.
From Awareness to Infrastructure
For years, digital marketers chased brand awareness. We built impressions, optimized for reach, and reported on vanity metrics. But the game has changed.
Today, AI models and search engines don’t just index content—they synthesize it. When someone asks a tool like ChatGPT or Google’s Search Generative Experience about your company, the system responds based on everything it has seen, learned, and inferred.
At that moment, your brand isn’t represented by your latest campaign or homepage headline. It’s represented by the composite reputation you’ve built across the web. That includes:
- How often your brand is mentioned
- What words are used to describe you
- Who links to your site
- Whether those links appear in trustworthy contexts
- And how consistently all of the above aligns
In short: your brand’s reputation is shaped by the web’s memory—and your job is to help shape what that memory retains.

The Reputation War Is a War of Memory
Let’s break it down. A better competitor doesn’t need a bigger ad budget to win. They just need to appear:
- More consistently described
- Across more trustworthy sources
- With fewer contradictions and more clarity
This creates what we call the reputation layer—a foundation of consistent, contextual, and credible digital signals that strengthens how your brand is understood by algorithms and humans alike.
Think of it like digital compounding interest. Each consistent mention, backlink, and structured data point strengthens your standing not just in Google rankings, but in the semantic networks that AI systems build behind the scenes.
Generative Engine Optimization: The Next Frontier
Traditional SEO is still important, but it’s no longer enough.
Enter Generative Engine Optimization (GEO)—a newer discipline focused on influencing how generative AI tools perceive and recall your brand.
Where SEO focuses on rankings, GEO focuses on representation. That means building the kind of consistent, contextual footprint that models use to answer questions, complete prompts, and offer recommendations.
GEO tactics include:
- Using consistent brand language across all digital channels
- Securing high-authority mentions and backlinks
- Creating well-structured, easily digestible content
- Optimizing metadata, schema, and semantic associations
- Encouraging trusted third-party coverage and citations
In GEO, the goal is not just to be seen—it’s to be understood accurately and repeated confidently by systems that influence buying behavior.
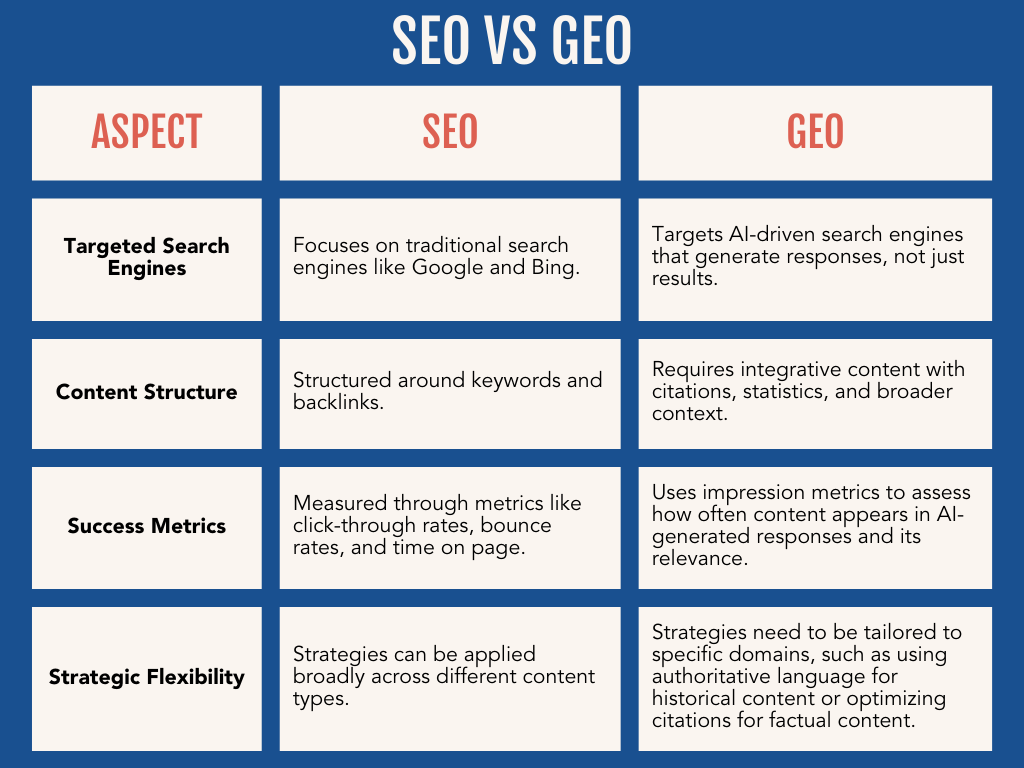
Consistency Is No Longer Optional
If your homepage says one thing, your press release says another, and your LinkedIn profile tells a third story, you’re not just confusing customers—you’re confusing the system.
And systems don’t forget.
Every inconsistency across your digital presence introduces ambiguity. That ambiguity weakens your authority, makes your content harder to categorize, and reduces the likelihood of your brand being surfaced in search or summarized in generative answers.
Consistency, on the other hand, creates semantic strength. It gives both humans and machines a clear, repeatable understanding of what your brand stands for, what you do, and why you matter.
Where Reputation Lives: Building Your Brand’s Memory Layer
To strengthen your brand’s reputation layer, focus on these four pillars:
1. Consistency Across Channels
Ensure your messaging, brand descriptors, and visual identity are aligned across every digital touchpoint—from your website to your social media bios to your executive bios on third-party sites.
2. Contextual Placement
It’s not just about where you’re mentioned. It’s about how you’re mentioned. Are you cited as a leader? Are you associated with innovation, security, growth? The language around your brand matters just as much as the link itself.
3. Credibility of Sources
Backlinks from high-authority websites (think trade publications, well-regarded industry blogs, or news outlets) send trust signals to both search engines and AI models. A citation in a reputable source can be more impactful than 100 low-quality mentions.
4. Structured Content
Make it easy for machines to parse your content. Use headers, schema markup, and plain language to reinforce key themes. Structure reinforces clarity—which reinforces trust.
Strategic Questions to Ask Right Now
If you want to gauge the strength of your brand’s reputation layer, start with these questions:
- Is our brand described consistently across all third-party platforms?
- Are we being cited or mentioned by credible sources?
- Do we control our entries in structured data repositories like Wikidata?
- Have we earned relevant backlinks from trusted websites?
- Does our messaging align across sales, marketing, PR, and executive thought leadership?

A Coherent Brand Is a Competitive Advantage
The brands winning today aren’t just investing in performance ads or clever copy. They’re investing in coherence.
They’re managing not just their content, but the context around their content. They’re shaping how others talk about them. And they’re being rewarded with better placement, more accurate representation, and stronger recall in both search engines and AI-generated responses.
If your brand is scattered, the system remembers that. But if your brand is disciplined, reliable, and strategically visible—the system rewards that too.
Reputation Is the New Brand Infrastructure
Inclusion is everything. But inclusion without control is chaos. That’s why reputation is no longer just a PR concern—it’s part of your core marketing infrastructure.
In an AI-first landscape, your brand’s reputation layer is one of the most powerful assets you have. Treat it like infrastructure. Maintain it. Reinforce it. Strengthen it over time.
Because the next time someone asks an AI about your business, it’s your reputation—your digital residue—that will answer.
Want to Strengthen Your Brand’s Reputation Layer?
Bluetext helps organizations build consistent, contextual brand infrastructure that performs across SEO, AI search, and beyond. Whether you need help aligning your message, earning the right mentions, or auditing your digital footprint—we’re here to help.