Working at a Washington DC digital agency that works with brands spanning the largest, most cautious Fortune 500 companies to the most speedy of start-ups disrupting every corner of Earth, we need to back up our creative and marketing recommendations with stats. Here are some that stats could arm you in your next planning phase, ranging from user experience design to marketing promotion and branding.
WHO ARE YOU BROWSING FOR?
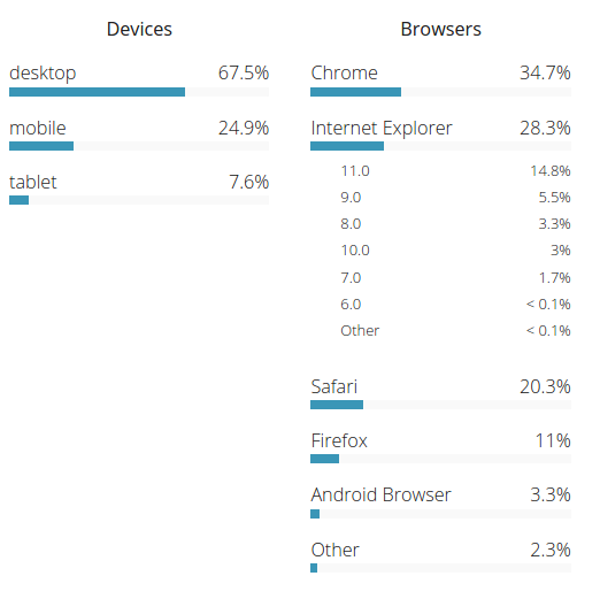
The latest stats are in from the US Government on Browser and device usage. Plan your next website user experience design based on these stats as well as the stats from your analytic application.
WHAT DID THAT ICON SAY?
According to ScienceDaily’s recent study, Icons need to tell something very clearly or face horrible usability issues with your user experience.
The recent report asked users to look at an icon and try to avoid thinking of both the word of that image, as well as how many letters that word had (for example, a subject is told to look at a iPhone and not think “iPhone” or think “6,” the number of letters in the word). Nearly 80% of people could not stop themselves from “sub-speaking” the word in their head and only 50% could stop themselves from saying the number of letters in the word. Stopping the brain from making associations in the subconscious is nearly impossible, which makes it extremely important to ensure that visual icons and representations are completely recognizable and aren’t easily confused by the user to have another meaning.
Placement of icons should not just be for visual effect. It can actually aid your user without making them think at all. It’s important that you choose the right icons as well, because you don’t want to trigger an automatic association from your user about something unrelated to the purpose of the icon.
DO YOU PERSUADE WITH VIDEO?
A recent User Experience Dynamic study by SearchEngineWatch shows that 73% of people will convert to the sites desired action when they enhance their user experience design with video.
HAVE YOU JOURNEYED BELOW THE FOLD?
Countless recent studies are showing that almost every user (yup over 99%!) these days are scrolling below the fold. Be adventurous and think of the user experience taking place on a tall dynamic canvas.
GOT SHARES?
Facebook continues to be the most widely used social channel for sharing. It gained 8.2% share and made up 81% of all shares in Q4. Sharing activity by email also increased, but it still only represents about 1% of total share volume. Looking at the channel distribution of sharing on mobile, Facebook edges out the competition even further. Facebook activity jumped 51% from last year and now represents 85% of mobile sharing activity. Pinterest and Twitter have also gained traction on mobile.