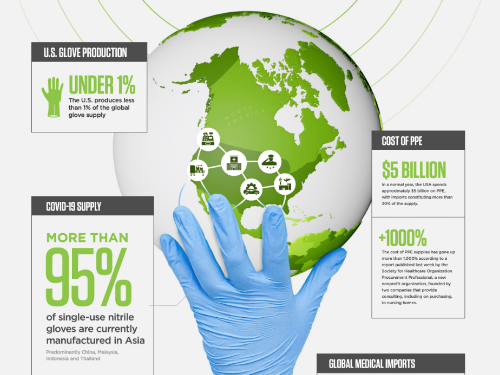
In the age of big data, where vast amounts of information are generated every second, the ability to effectively communicate insights is more crucial than ever. Data visualization stands at the forefront of this effort, transforming complex data sets into clear, actionable insights. At Bluetext, we understand the power of data visualization in making sense of big data, and we’re here to share how mastering this skill can revolutionize the way organizations interpret and use data. In this blog post, we’ll delve into the importance of data visualization, key principles for creating effective visualizations, and the future trends shaping this field.
The Importance of Data Visualization
Data visualization is not just about making data look appealing; it’s about making data comprehensible. Here’s why it’s indispensable in the age of big data:
- Simplifying Complexity: Big data is often complex and unwieldy. Data visualization breaks down this complexity, allowing stakeholders to grasp intricate data sets quickly and accurately.
- Revealing Patterns and Trends: Visual representations make it easier to identify patterns, trends, and outliers that might be missed in raw data tables. This can lead to more informed decision-making.
- Enhancing Communication: Effective data visualization facilitates better communication across teams. By presenting data in a visual format, insights can be shared more easily with non-technical stakeholders, fostering a data-driven culture.
- Driving Action: Clear visualizations can highlight critical insights that drive strategic actions. When data is presented compellingly, it’s easier to make decisions that are backed by evidence.
Key Principles for Effective Data Visualization
Creating effective data visualizations requires a blend of art and science. Here are key principles to guide the process:
- Know Your Audience: Tailor your visualizations to the needs and knowledge level of your audience. What works for a data scientist might not work for a marketing executive.
- Choose the Right Type of Visualization: Different types of data call for different visualization techniques. Bar charts, line graphs, pie charts, scatter plots, and heat maps each serve specific purposes. Choose the one that best represents your data.
- Simplify and Focus: Avoid clutter by focusing on the most important data points. Use color, size, and layout to draw attention to key insights without overwhelming the viewer.
- Tell a Story: Data visualizations should tell a story. Provide context, highlight important trends, and guide the viewer through the data to ensure that the narrative is clear and compelling.
- Ensure Accuracy: Misleading visualizations can lead to incorrect conclusions. Ensure that your data is accurately represented, and avoid distortions that can mislead your audience.
Tools and Technologies for Data Visualization
The rise of big data has brought with it a plethora of tools and technologies designed to facilitate data visualization. Here are some of the most popular:
- Tableau: Known for its user-friendly interface and powerful analytics capabilities, Tableau is a favorite among data professionals for creating interactive and shareable dashboards.
- Power BI: Microsoft’s Power BI integrates seamlessly with other Microsoft products and offers robust data visualization capabilities, making it ideal for businesses already using the Microsoft ecosystem.
- D3.js: For those with a knack for coding, D3.js is a powerful JavaScript library that allows for the creation of highly customized and interactive data visualizations.
- Looker Studio: This free tool from Google allows users to create interactive reports and dashboards, making it a great choice for organizations looking to leverage Google Analytics data.
- Qlik Sense: Qlik Sense offers powerful data integration and visualization features, making it a strong choice for organizations dealing with diverse data sources.
The Future of Data Visualization
As technology continues to evolve, so too will the field of data visualization. Here are some trends to watch:
- Augmented and Virtual Reality: AR and VR are poised to take data visualization to the next level, allowing users to interact with data in immersive, three-dimensional environments.
- Artificial Intelligence and Machine Learning: AI and ML are increasingly being integrated into data visualization tools, providing more advanced analytics and automated insights.
- Real-Time Data Visualization: With the growth of the Internet of Things (IoT) and other real-time data sources, the ability to visualize data in real-time will become increasingly important.
- Enhanced Interactivity: Future data visualization tools will likely offer even more interactive features, allowing users to explore data in new and innovative ways.
Conclusion
Mastering data visualization is essential for communicating insights effectively in the age of big data. By simplifying complexity, revealing patterns, enhancing communication, and driving action, data visualization empowers organizations to make better decisions and stay ahead in a data-driven world. At Bluetext, we are committed to helping businesses harness the power of data visualization to unlock the full potential of their data.
If you’re ready to elevate your data visualization capabilities and communicate your insights more effectively, contact us at Bluetext. Together, we can transform your data into a powerful tool for strategic success.


