At Bluetext, we help many companies and organizations tell their brand stories through a family of imagery that delivers the message, attitude, and tonality for which marketing leaders are hungering. Our clients want a platform for their brand that they can own, because as many markets become commodotized, this kind of differentiation allows them to stand out and represent their brand’s value.
Here are some recent samples:
Leveraging CSC’s brand mark, Bluetext was able to create these representative solution areas.

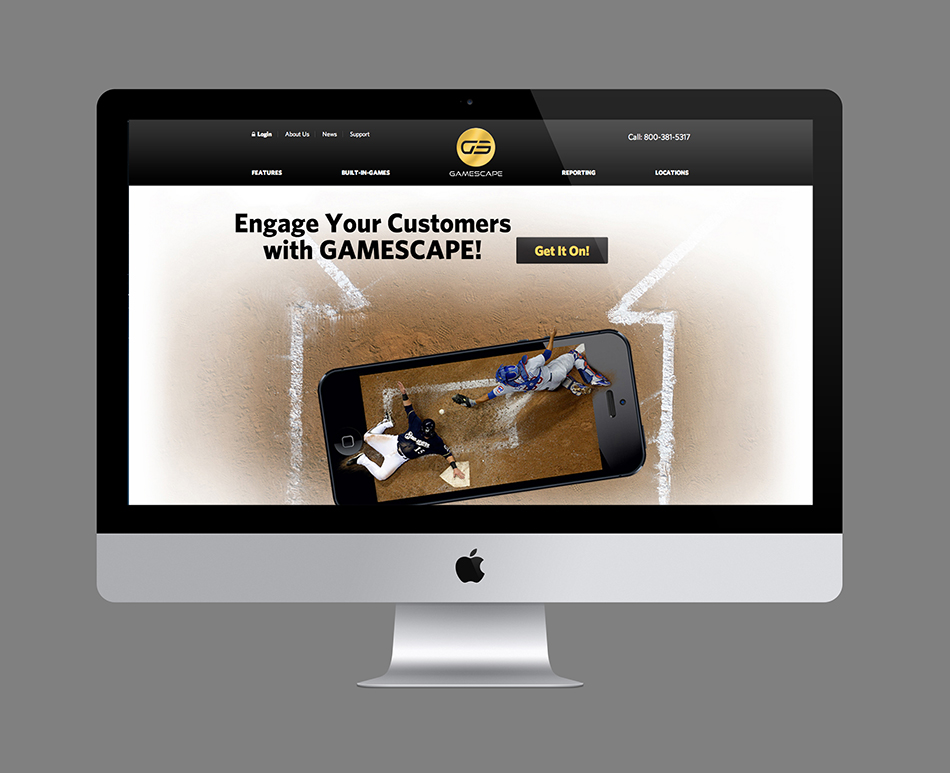
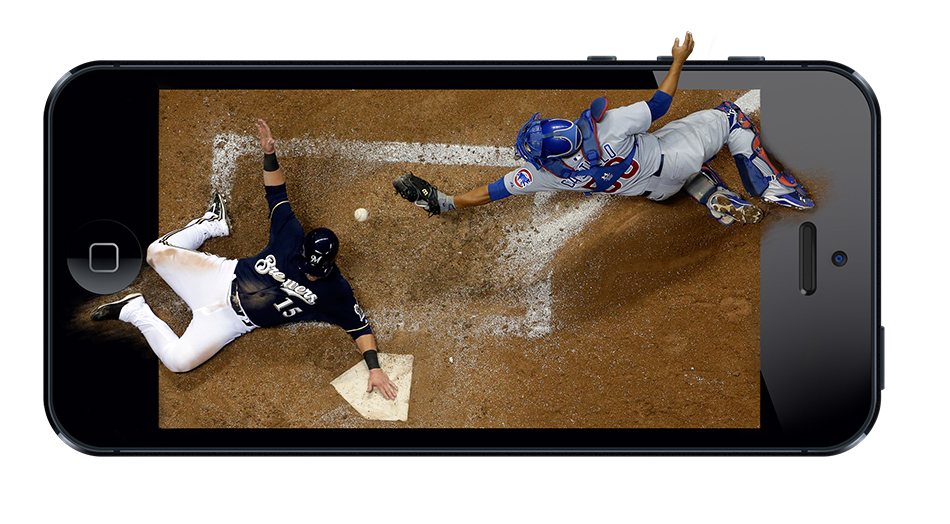
Gamescape produces eye-popping marketing retention programs leveraging gamification, social media, and a fire hose of sports data to deliver a completely brandable fun new experience for local and national bar and restaurant establishments across the country

Iron Bow retained Bluetext to bring its solution areas to life in a fresh new and inviting way. Iron Bow wanted to be portrayed as approachable.

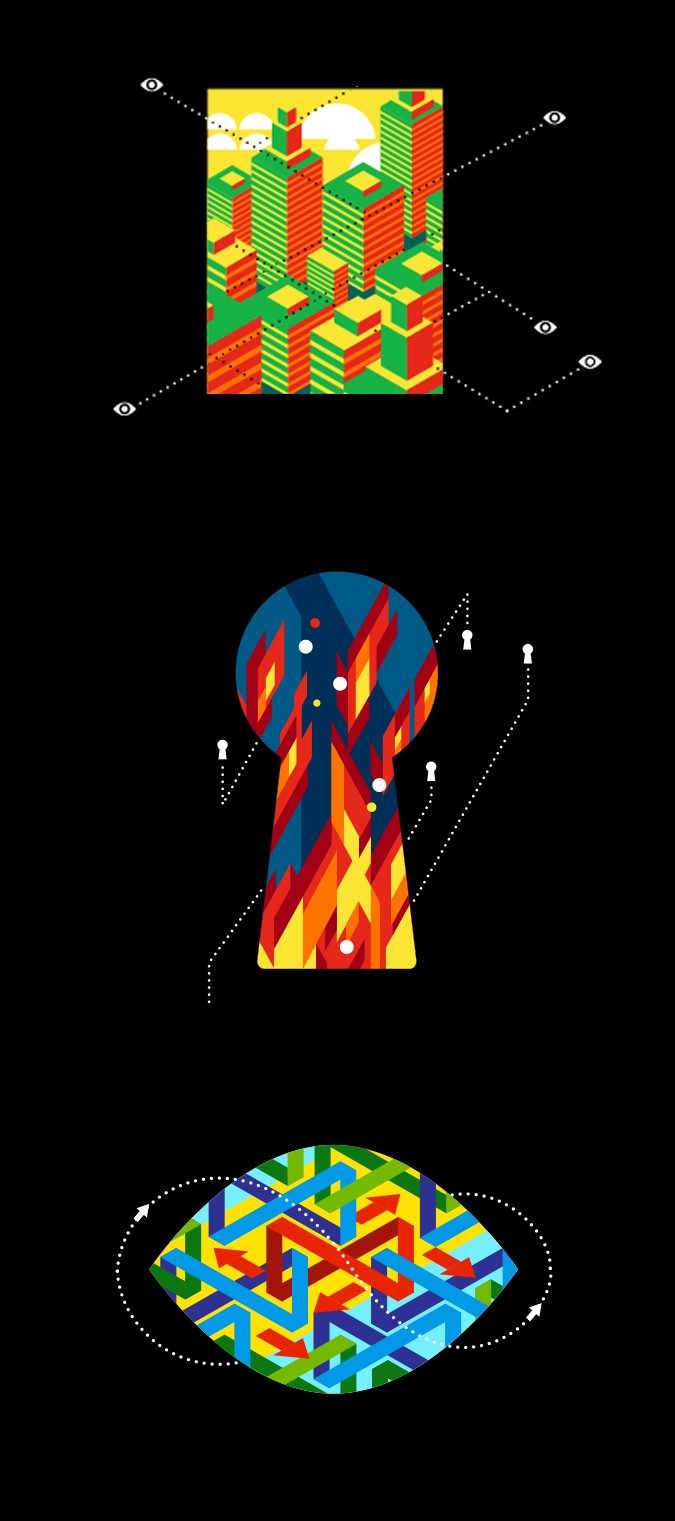
Bluetext designed a series of illustrations consistent with a new brand attitude architecture. The four dimension illustration series was used throughout hundreds of assets for Sourcefire with both a white and black base design system, following research that the black and white option would be advantageous for Sourcefire marketing.
VMWare retained Bluetext to bring its value proposition to life in a fresh new and inviting way.

Bowman needed to convey their multi discipline multi vertical end to end solutions in a visually compelling way

Gamescape, the brainchild of two die-hard fantasy sports enthusiasts and marketing entrepreneurs, came to Bluetext with a clear mission: create a gamification experience leveraging daily fantasy sports that drives customer loyalty as a brandable solution for bars, restaurants and other venues nationwide.
Bluetext took this concept and, with the Gamescape team, and did every aspect of their branding, marketing, and platform design and development.
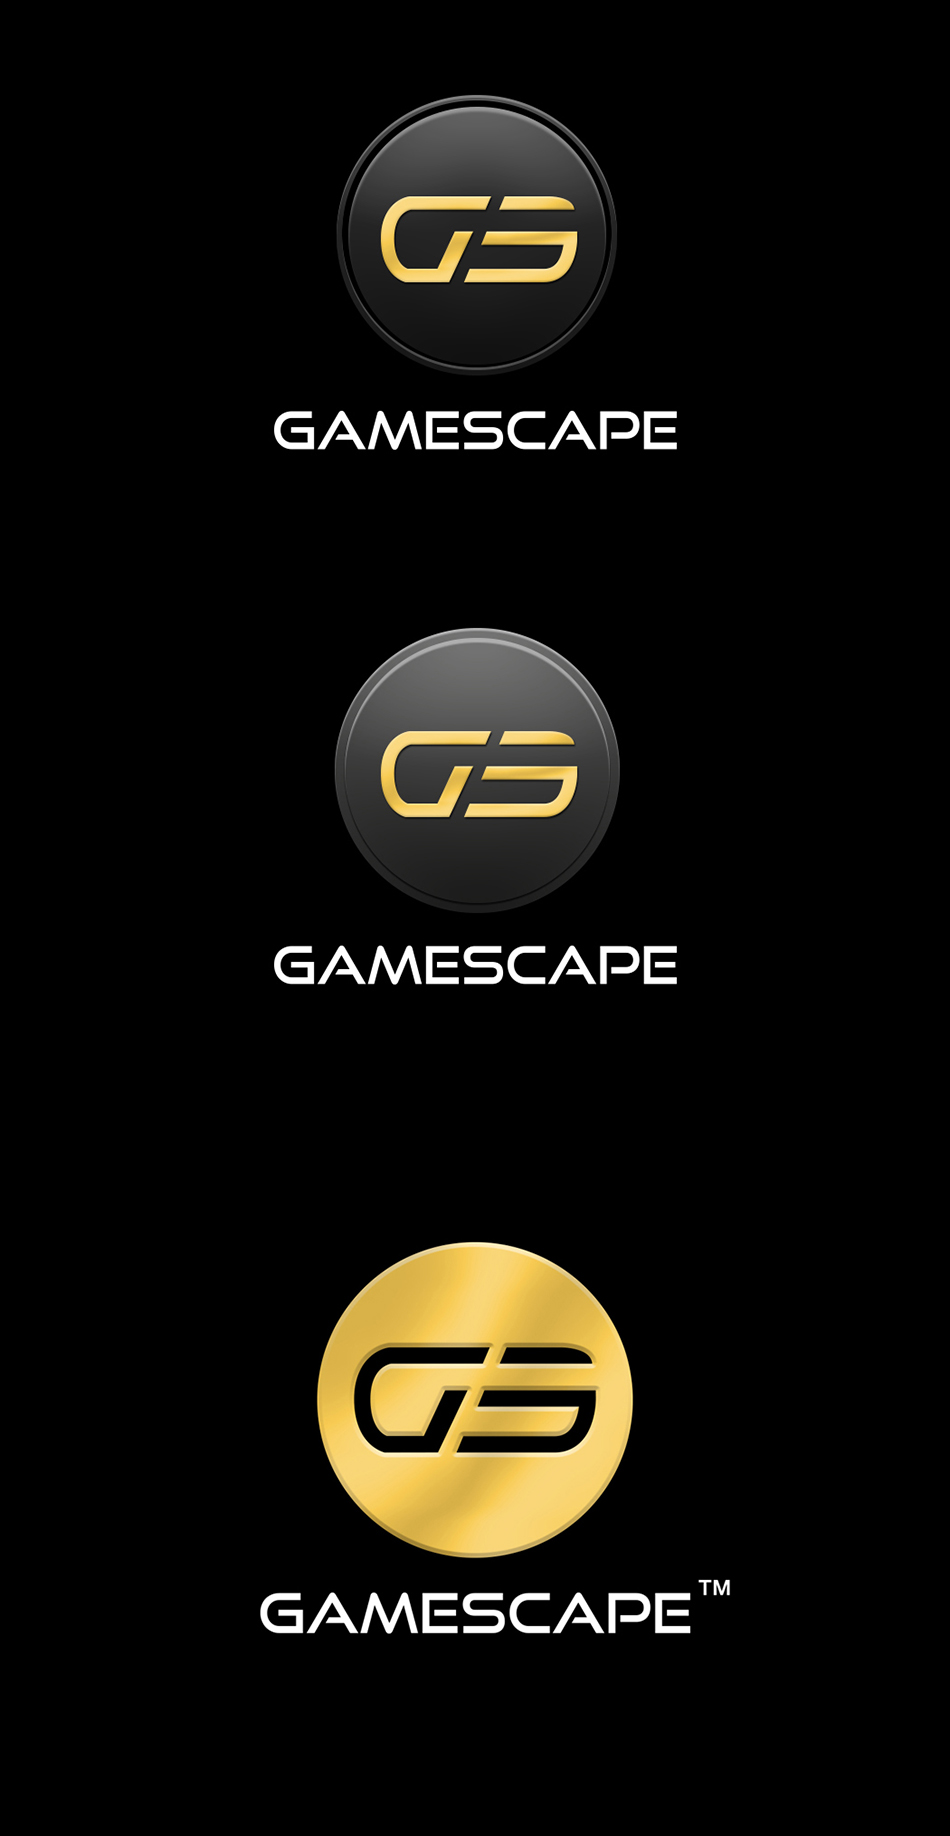
The first step was to develop a killer brand for Gamescape . Inspired by the gold coin patrons earn when making the correct fantasy sports selection while enjoying themselves at the venue. Here is a preview of our internal logo progression.
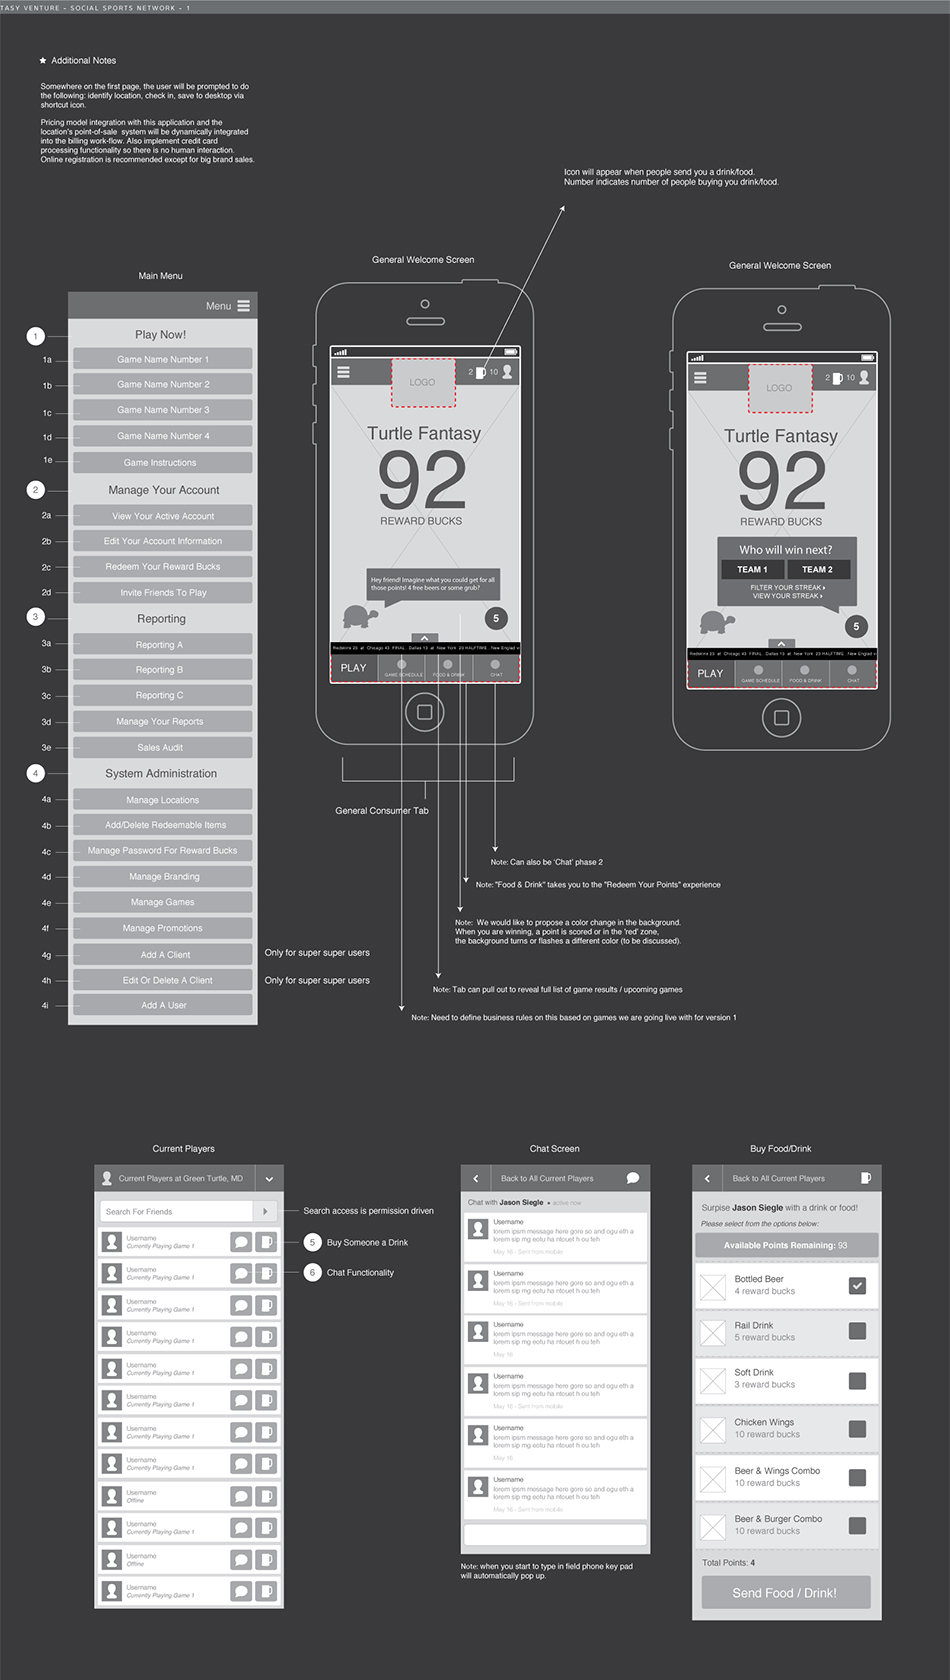
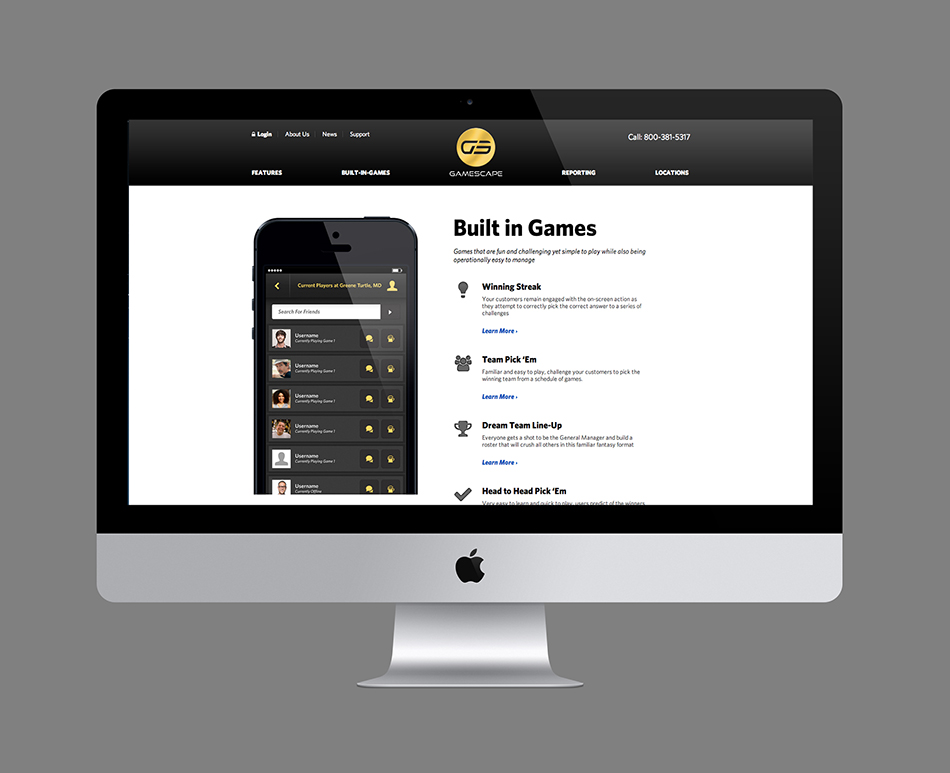
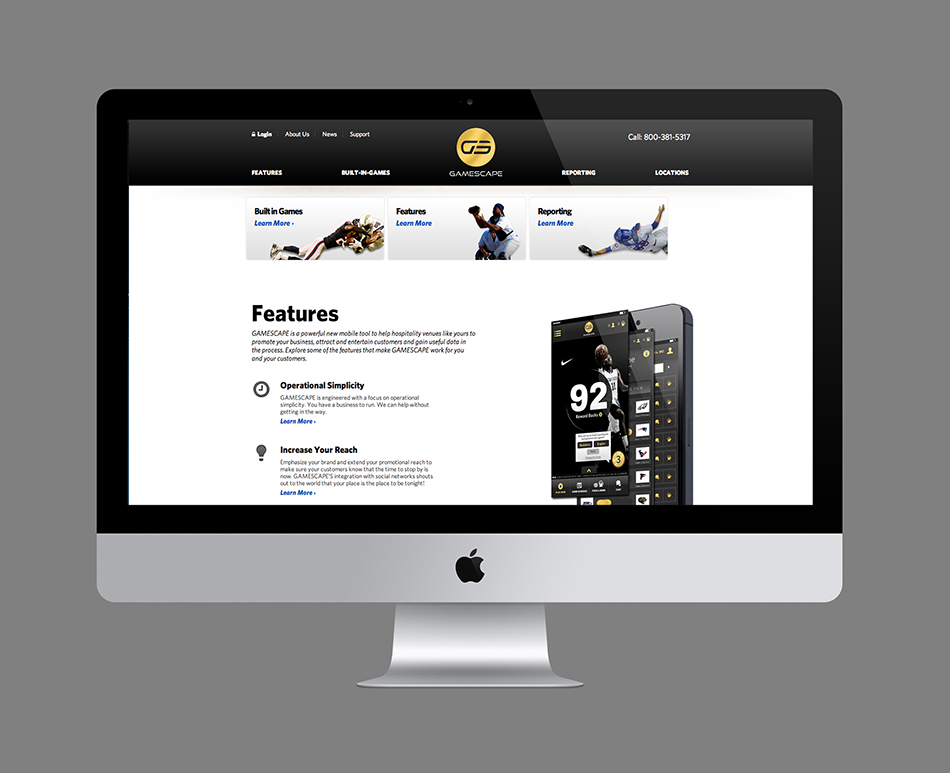
Bluetext started the interaction design process by performing a technical assessment of requirements gathering. We needed to create a sophisticated application that included a robust sports fantasy system , a messaging system for patrons to interact together, and profile creation with location-based geo-fencing. On top of all of that the new platform had to be visually striking, extremely intuitive and easy-to-use.
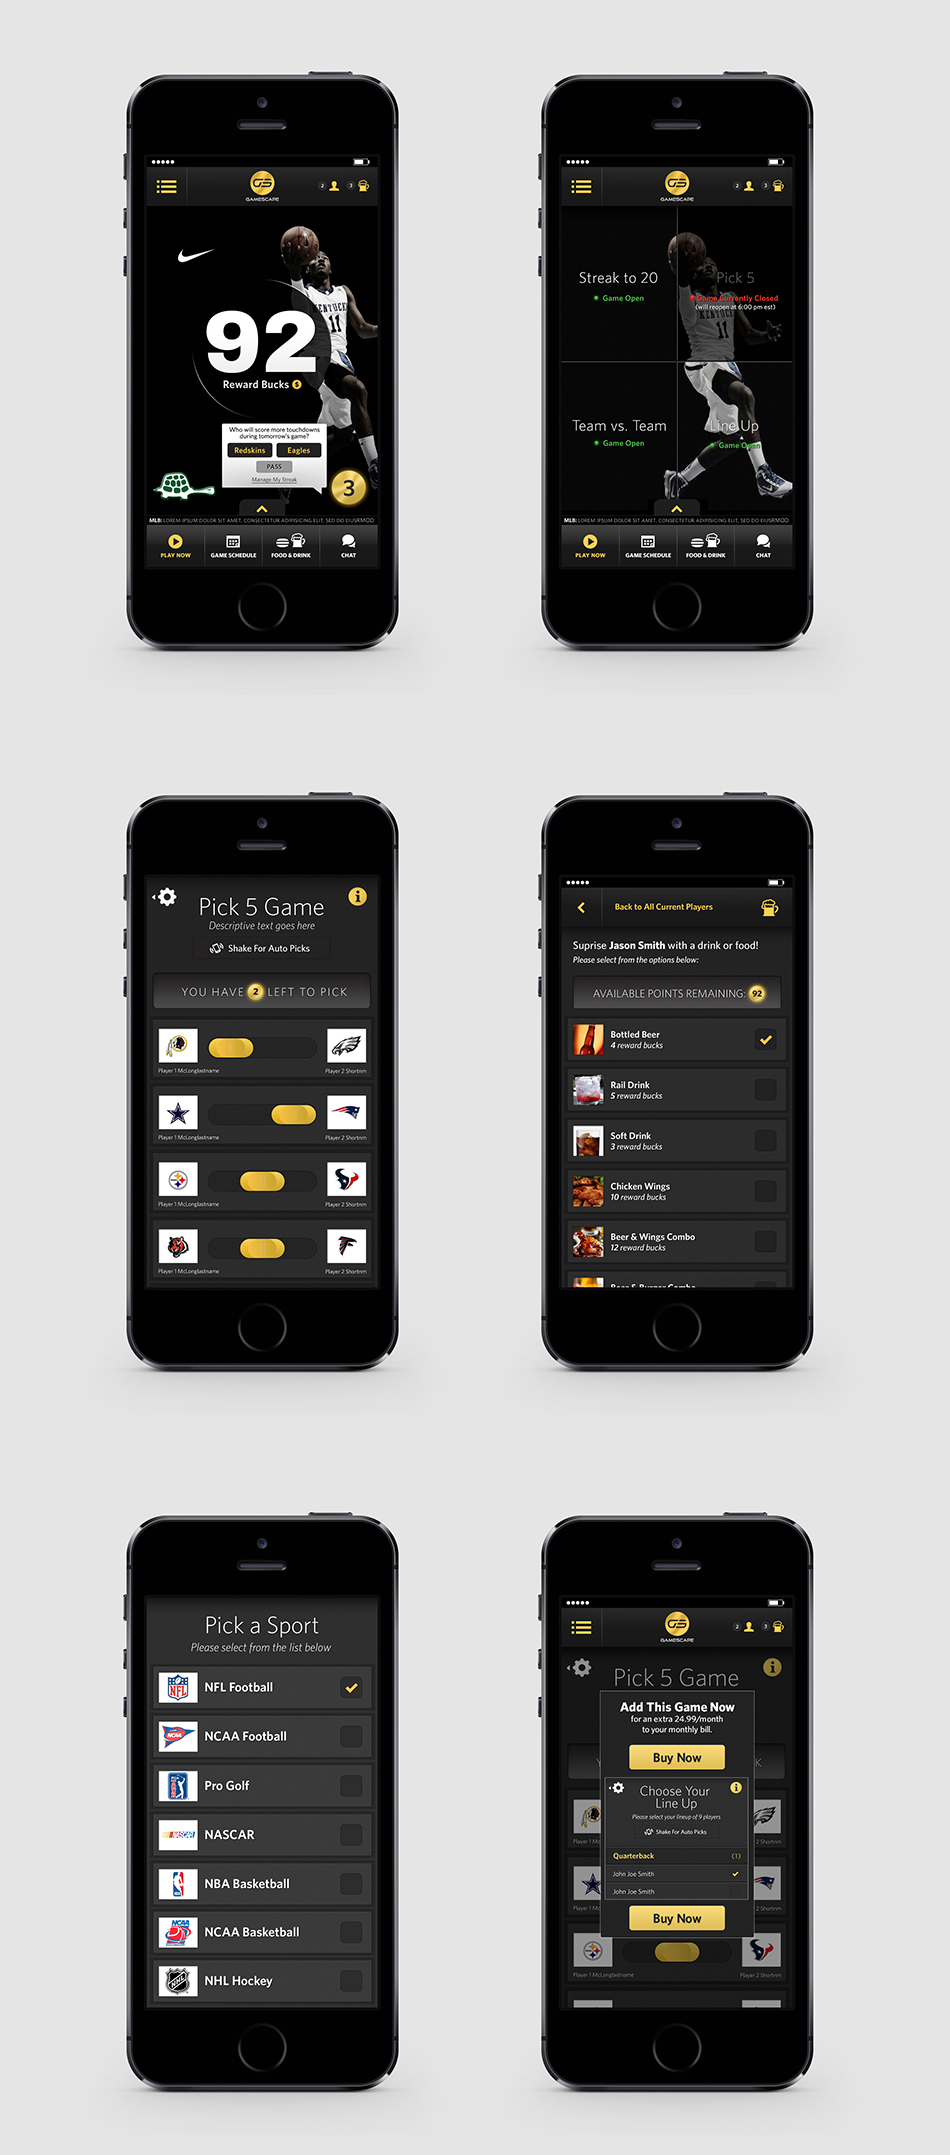
From loyalty-building rewards points to new ways to communicate with your customers, GAMESCAPE offers an impressive suite of features focused on increasing the opportunities to interact and connect with your guests while offering them new entertainment options. GAMESCAPE’s geofencing technology requires players to be in your establishment in order to join a game.


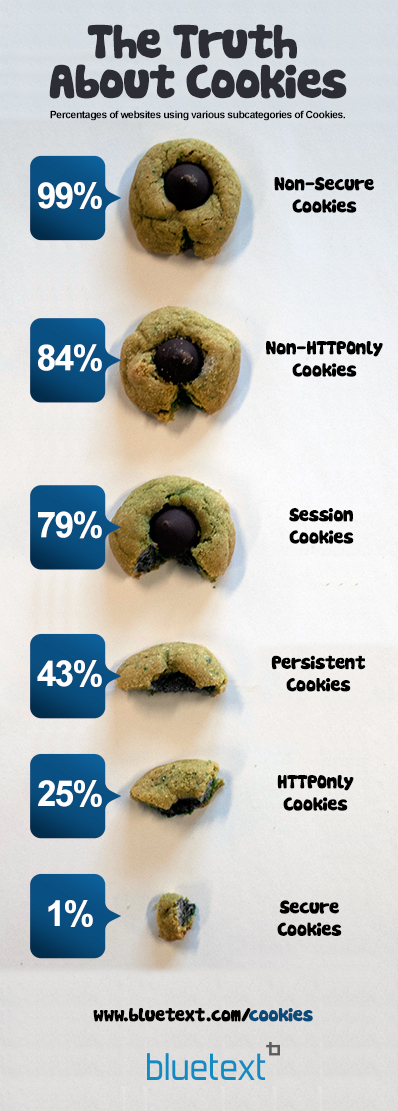 The third-party cookie is under attack and may soon be a thing of the past. Microsoft recently confirmed that it was developing a new tracking technology to eclipse the cookie. The idea is to have a proprietary product that it controls across platforms allowing it, and other large players, to consolidate their power through newer tracking technologies.
That might sound like the natural progression of online marketing. After all, cookies have several challenges that critics use to argue for their demise. From a privacy stand-point, many privacy advocates see third-party cookies, the ones that marketers and advertisers use to follow individuals, as intrusive. And indeed, Microsoft and other players say they have protecting consumer privacy in mind with their new technology.
But more important from a marketing standpoint, cookies are remnants of technology designed to follow users across desktop browsers. They don’t transfer to mobile devices and platforms, let alone Xbox, PlayStations and connected television and the host of new ways consumers are accessing the Internet. An advertiser has no way of knowing, for example, if a sale came from an ad viewed on a cell phone or other device because of this limitation.
On the other side of the debate, advocates for cookies point out their benefits, including as an open source technology that has been a key element in “democratizing” the Web. The technology has allowed small publishers and bloggers to flourish, and has enabled marketers to anonymously and efficiently target consumers on the Internet.
Let me give you an example of how we use cookies for our clients’ campaigns to deliver the right kind of information to their potential customers. As part of a campaign, we often create lead-generating landing pages and microsites that contain useful information on an industry challenge for which a company has a range of solutions. A visitor might go to that site and search for white papers or other premium content on a specific challenge they are facing. By utilizing an anonymous cookie to that individual, we can serve up a series of banner ads that direct him or her to more information. If the person had gone to a page on pricing, a marketer can logically guess that this person is most likely a potential buyer and can deliver banners that are tailored to that stage of the buying process. Cookies enable this type of efficient and effective targeting to work.
As one observer recently wrote, “In clamoring for the demise of third-party cookies, privacy advocates may be urging the creation of a system that elevates proprietary tracking technology – technologies that may stifle competition and may be an even bigger privacy concern with personal data being concentrated in the hands of a few powerful corporations.”
We’re not quite that alarmist, but it is worth recognizing that third-party cookies are an important part of many of the targeted campaigns that Bluetext designs and implements for its clients. They allow companies to identify potential customers who have expressed an interest in their solutions through Web searches, and provide information and links tailored to those specific interests. This type of narrow-casting ad delivery makes targeting much more efficient, serves up information relevant rather than random to users, and provides needed revenue streams to web properties including news and information sites.
“In order to pay for a better and more expensive internet we need to continue to improve online advertising,” said Zach Coelius, CEO of automated ad buying company Triggit told AdAge. “There are only two ways we can do that: One is to make the ads more intrusive, bigger and in your face, or two, we can make them more targeted so that we no longer have so much waste with the wrong ads going to the wrong people.”
Why is this so important for marketers? First and foremost, it marks a potential trend by Microsoft and other large internet platform companies to control how individuals are tracked and followed across their browsing. That’s good for those large corporations, but not so beneficial for companies that will have to purchase or obtain that information from them. It reverses the path of “democratizing” the Internet that cookies allowed for in the first place.
So what do marketers need to do now that Microsoft is going to make it more difficult to identify and track potential customers through third-party cookies? Here are a few recommendations:
- First, cookies aren’t going away yet. There will still be a need and market for them, so don’t abandon the ship.
- Be creative! Targeted campaigns that use premium content and compelling creative will attract attention from potential buyers and customers.
- Content will still be king, and content syndication can drive key targets back to your campaign site.
- Three-part campaigns that combine digital, physical and follow-up marketing will deliver better results than a one-dimensional effort.
- Follow the trends. If the large platform players are transparent about the information they collect on your behalf and can demonstrate solid results, they may be worth a try.
- Social media sites that allow segmented targeting, like Facebook and LinkedIn, will offer strong alternatives to traditional banner ads.
- Try a little bit of everything, split test messages and creative, and refine and revise until you have the best combination to deliver the results you want.
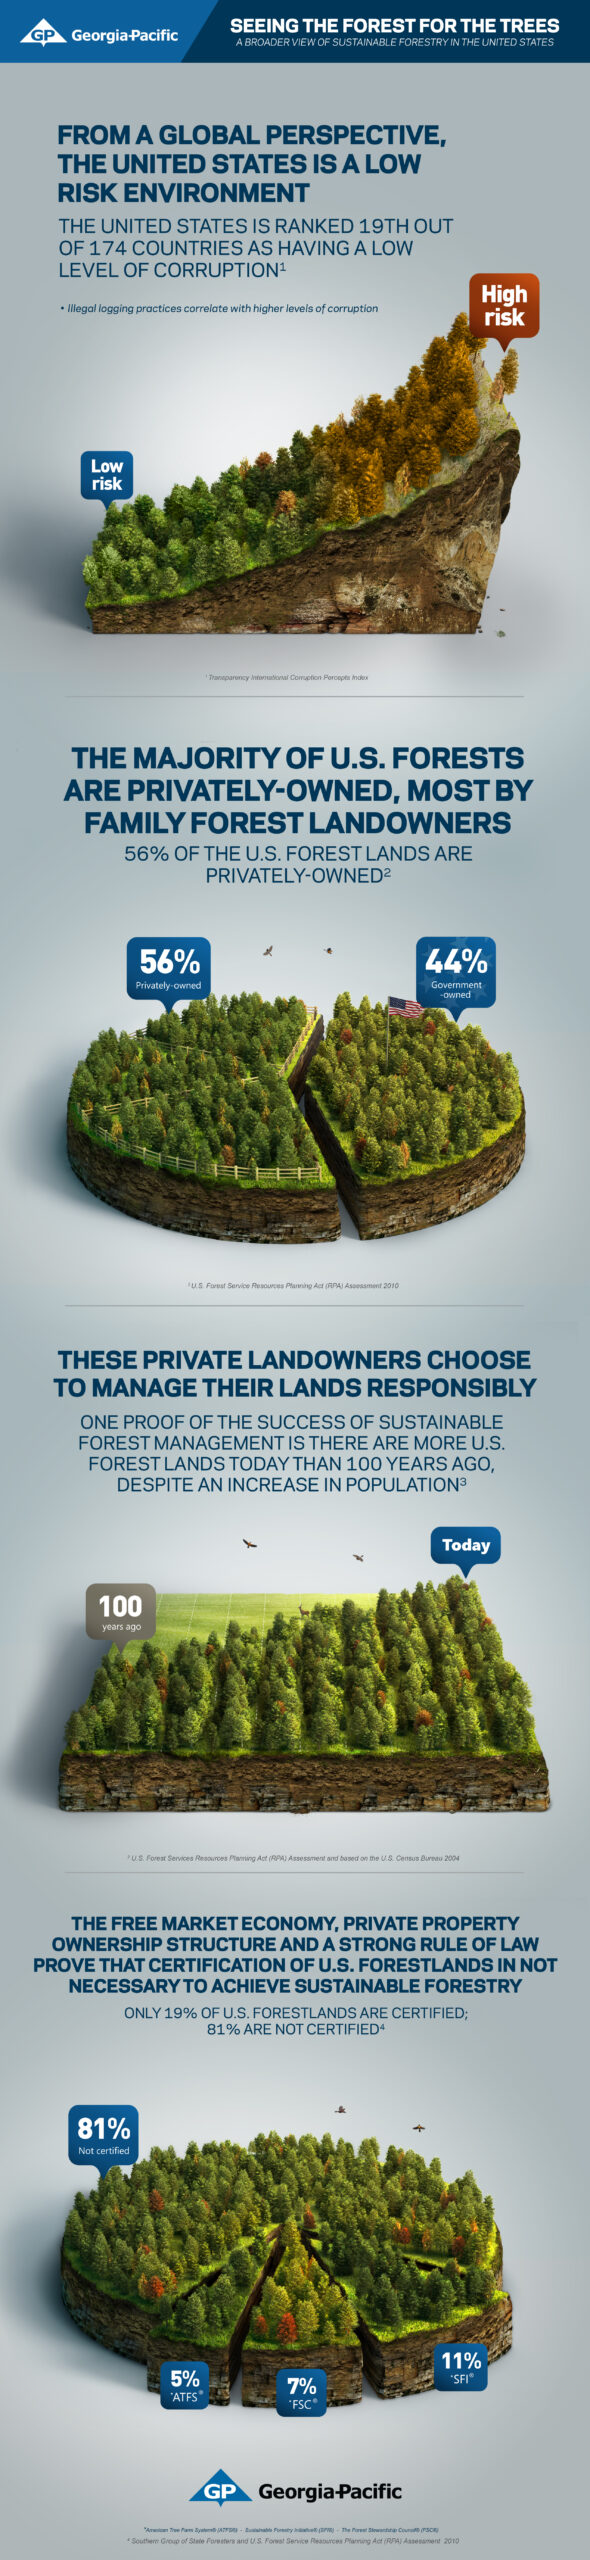
Georgia-Pacific turned to Bluetext to develop a campaign to most effectively share its approach for sustainable forestry in the United States. In the United States, the free market economy, private property ownership and a strong rule of law have created an environment where forests are responsibly and sustainably managed, and illegal logging is not an issue. Georgia-Pacific practices, promotes and supports sustainable forestry through a broad range of methods which are outlined in this infographic themed “Seeing the forest for the trees.”
Infographics—Today’s Press Release
The Why and How of Telling a Story with Data Points
You might have the best content around, but if no one sees it, what good is it for your brand?
I think we can all agree that people don’t have time to read white papers or even press releases. They scan rather than scour. To get their attention, you need to grab them quickly, with easily digestible content and compelling graphics that tell the story at a glance. For this reason, infographics are becoming a requirement with every marketing campaign. They can accomplish in one screen what would otherwise take pages of text, and they can be an opportunity to present your brand in the best possible light.
Yes, infographics have become today’s press release. Bluetext clients are clamoring to take their data and turn it into provocative infographics. But then what? How do you ensure that key audiences will see, and digest, this gorgeous piece of storytelling art?
Here are out top tips on how to get visibility with an infographic:
- Make Sure Your Content is Credible. Team with a research or think tank to develop compelling data points. Credible content with a built in audience base are great components to an infographic campaign.
- Use premium content to promote the infographic. Create a blog post for the infographic and support promotion through the blog’s social channels (Facebook, Twitter, Email, social news & bookmarking sites).
- Optimize for sharing. Providing graphics optimized for sharing is important, so take care to present your art in a very friendly manner to maximize impact. A week or two after publishing and promoting the infographic, upload the full image and unique description to Flickr with a link back to the original web page.
- Tease out the data points. Extract the data points integrated in the infographic and drip them out with links back to the infographic webpage. A similar, but more visual approach can work with Facebook as well. LinkedIn’s redesign is very oriented to visual communications, so this tactic also works well there.
- Leverage aggregators. Submit the infographic to popular infographic aggregators and directories. An example is http://www.visual.ly/
- Put it out over the news wires. Drive visibility to the infographic by leveraging it within a media release that includes a link to the full infographic and distribute through a news distribution services.
- Earned Media is also good. If the data is newsworthy, pitch it out as a story to trade and other publications that might be looking for a good graphic on the topic. And don’t forget bloggers who might also be interested.
- Send it around via email. Leverage email marketing by blasting this infographic to all your in-house as well as purchased email lists.
- Tweet this, Like this, Recommend this, Pin this. Be sure social sharing is always integrated next to the infographic. Whatever the sharing mechanism is, offer them all.
- Animation will take it up a notch. Leverage the infographic into rich media and animation. Look at our latest animated infographic here for Riverbed.
- Make it easy to use. Port the infographic into Powerpoint format to support sales enablement and other marketing communication functions. Publish this on SlideShare, Scribd, DocStoc, and other social document sharing services.
- Keywords are important. Stuff keywords that are search engine relevant. This will help drive organic visibility.
- Streamline distribution. Provide embed code for your infographic to streamline sharing and posting into the blogosphere.
2012: The Year Government Goes Mobile
A game-changing development is quietly taking place within government agencies. It will have significant implications not only for agencies but also for companies doing business with those agencies. The evidence is so strong, we can safely predict that 2012 will be the year that the majority of government workers go mobile for work—migrating from desktops to mobile devices and performing their job on a wide variety of platforms unchained from their desks.
At Bluetext we began to notice this last year when looking at the analytics of the websites, microsites, and landing pages we’ve designed and launched for some of our technology clients, all targeted at government employees. These include GovDefenders.com for DLT Solutions, Oracle, Symantec, and Quest Software; TheCloudPlaybook.com and DataCenterChampions.com for NetApp resellers; and GovTransformers.com for Google. More and more visitors to those sites—more than half of the traffic by the end of the year—were arriving by way of the mobile versions of Android and Safari.
While the move to mobile has been a topic of conversation for several years, our data suggested that it was happening more quickly and more pervasively in the government than previously believed. We decided to survey federal employees that work in information technology (IT) and ask them directly. With the help of the opinion research firm Fabrizio Ward we surveyed 200 federal IT workers shortly before Christmas. The conclusions confirmed our data.
The survey found that 45% of IT staff are using mobile devices, including tablets and smartphones, for work on a daily basis, and another 7% are doing so at least once a week. In other words, more than half of IT workers are now regularly—if not daily—relying on mobile devices to do their job. We then asked about their non-IT colleagues, and here’s where the adoption starts to get pervasive across agencies. Thirty-eight percent reported that many of their colleagues are using mobile devices, while another 19% reported that most of the employees across their agencies are doing so. Only 3% said that none of their colleagues are using mobile. This means that not only are the majority of federal IT staff using mobile devices for work, but that the majority of non-IT staff have also migrated to mobile.
That’s more than a trend.
Indeed, those who are using their mobile devices for work are doing so frequently. The survey found that of those who have gone mobile, 66% are doing so daily, and another 22% are doing so at least once a week. While email was by the far the more common application for mobile access, more than a third were using project management tools, and another 20% were using social media for work. (Facebook was the most-used social media platform on mobile devices, followed by Twitter, Google+, and LinkedIn.)
This is important news for government agencies which need to act more like the commercial organizations if they want to efficiently meet their mission demands and attract the highest caliber employees. But it’s also a challenge to companies who want to communicate with and engage government employees—if you want to be heard, make sure your digital strategies are mobile-friendly and optimized for all devices.

