In the crowded and highly-competitive non-profit market, how do you differentiate your brand from your competitors?
While you’re thinking about how to stand out from the crowd, download a poster from our Adult Coloring Book that you can bring to life, and let Bluetext solve your bigger marketing challenges.
Download our Adult Coloring Book here!

Today’s landscape requires the need for constant database care and feeding…smart marketing campaigns, hyper targeted, very personalized, with highly engaging and rich creative presentation. Spray and pray marketing tactics have not worked for quite some time, and just trying to mimic the new hot buzz wordy marketing approach doesn’t also pay off as well as a thoughtful, disciplined and collaborative developed marketing strategy between a client and its marketing agency. So where does the” certified” and the “vegetarian” come in?
Vegetarian Marketers love TOFU. That’s their meat!
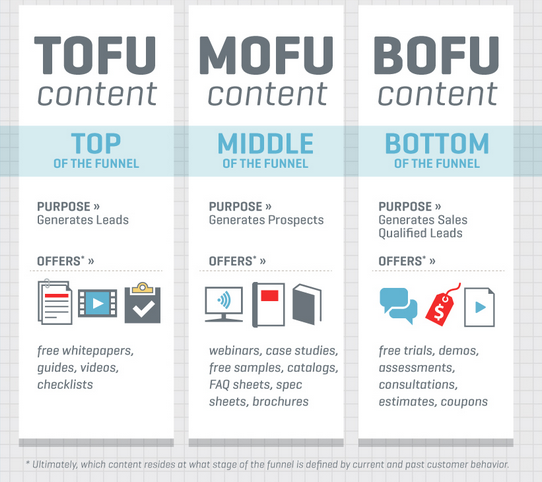
What’s TOFU?
Top of Funnel focused marketing activities.
Or better defined.
Good top of the funnel content marketing serves to commence a relationship (by way of opt-in) with a prospect visiting your site who otherwise might leave without making contact
Here are the key questions you should ask when putting together top of the funnel content.
- Does this intersect my prospects’ information journey at the right point?
- Does this look to take control of the information journey thereafter?
- Is this too obviously marketing?
- Have I considered what else I’ll back up this content with?
Why TOFU (Top of Funnel)?
There is no middle of the funnel or bottom of the funnel without the top of the sales funnel. The challenges brands experience in the middle of the funnel usually fall into one of two areas. The first area is non-opportunities. These are the “deals” that aren’t qualified opportunities at all. The second group is stalled opportunities. These opportunities are usually missing some of the commitments necessary to move them forward internally. The end of the funnel problems are usually around capturing value. But top of the funnel problems are far trickier. Think about how a funnel works. If you feed it in dribs and drabs you get dribs and drabs out of the other end. But if you keep a nice steady stream pouring into the funnel, you get a nice steady stream out of the skinny end.
Make a long story short. Worry first—and most—about the top of the sales funnel.
Now for the “certified” part of the equation
Bluetext works with many marketing automation and CRM systems, including Eloqua, Hubpost, Marketo, Pardot, and Salesforce – integrating, configuring, pushing creative through them, optimizing with them. These tools are the personalization marketing brain and the central data hub of value that all of our blood, sweat and tears deliver for our clients every day.
Bluetext is proud to announce we have expanded our credentials by being named a certified Hubspot agency.

Why work with an agency that has certified credentials versus a lot of lip service?
There are a lot of agencies that offer marketing automation services, but not all of them have the appropriate certifications. For organizations looking to partner with an agency to help them with their marketing automation readiness and implementation it is important to verify that an agency has the expertise to do so. A HubSpot Certified Agency Partner provides validation of the depth of an agency’s inbound expertise.
Bluetext delivers innovative content marketing campaigns for many consumer brands like Google, WeatherBug and SoundExchange. Contact Bluetext to learn how we can build your sales funnel with innovative digital content marketing services.
One of the most popular video series anywhere right now is comedian Jerry Seinfeld’s “Comedians In Cars Getting Coffee,” where Jerry takes other comedians out for rides in classic cars, and then they get coffee. It sounds simple, but it’s very funny, and very well-done. But what’s unique about the series is how it is designed: The videos are made first and foremost to be seen on mobile devices, not on television sets or even desktops or laptops. These aren’t just “mobile-friendly,” they were shot on video for the very small screen.
Once you know that, you can watch and see how that is done. All of the shots are tight on Jerry and his guests. Images of people and cars fill up the screen. Colors are rich and saturated, coffee cups are shown in close up, even the froth of the cappuccino is given over to the screen. There is no small type to get lost or details that can’t be seen on a small device. And while they still look good on larger screens, this is a mobile-first design in its purest form.
What does “Comedians in Cars” tell us marketers about video campaigns?
Number one, it’s a clear sign that consumers are comfortable ingesting rich content in its most compact form—on the small screen of a mobile device. If Jerry Seinfeld is creating for the smallest of video sizes, then that is where the audience is moving. And if marketing is going to reach this audience, it needs to create content that works well in that format.
Number two, creating a mobile-friendly video cannot be an after-thought. Every aspect of the design of the video, from concept and storyboard to shooting and post-production, must contemplate the mobile device as the primary focus. Not only must all of the key images be seen in tight focus, but any calls-to-action must be large and easy to read. Text must be minimal and clear. Subtlety is not your friend. Actions must be obvious and dialog crisp.
Number three, and assuming the video will be hosted on your company website, the video player must be capable of managing a responsive video, and your video size must be device agnostic. Your video content should be visible on an iPhone, a larger mobile device and a large monitor.
Number four, choose a bold image for your splash screen while the video is loading. It will draw viewers in and it’s good for search as it will make your video easily recognizable. Here’s an example of a bold splash screen image:
Finally, think carefully about your Call to Action. CTAs in videos on a mobile device may not be clickable. If you are unable to create a clickable CTA, consider a CTA that’s external to the video but still on the landing page.
As consumers rely on their mobile devices for gathering the information they need to make purchasing decisions, a video that is truly mobile first can move you ahead of the competition.
Apologies in advance if you now have the 1981 Olivia Newton-John classic stuck in your head for the rest of the day. If you live on the East Coast you have no doubt been getting “very physical” the past few days if you catch my snowdrift. After all, it’s hard work moving bottomless mounds of snow from one heap to another. What did you think I referring to? C’mon now, let’s keep it kosher.
Digital marketing became increasingly essential to consumer marketers in 2015, but there is strong evidence that digital is being elevated from just another item in the CMO toolbox to a pervasive ingredient to all marketing activities.
Exhibit A is findings from the Gartner 2015-2016 Chief Marketing Officer (CMO) Spend Survey, that focused on business leaders responsible for marketing – digital marketing in particular – across 339 large and extra-large (whatever that means) companies in North America and the U.K. A whopping 98% of CMOs consider digital marketing mainstream and that online and offline marketing are merging.
Commenting on the results, Yvonne Genovese, group vice president at Gartner, notes: “Marketers no longer make a clear distinction between offline and online marketing disciplines. As customers opt for digitally led experiences, digital marketing stops being a discrete discipline and instead becomes the context for all marketing. Digital marketing is now marketing in a digital world.”
In our marketing projects with leading consumer, business and public sector organizations, we are seeing significant demand for the “digitally led experiences” that Gartner references. There are a few digital marketing trends in particular that consumer marketers should keep their eyes on in 2016:
Smartphone ad geo-fencing
Consumer marketers recognize the need to map digital marketing into the consumer buyer’s journey when these digital assets can have the biggest impact. At what moment and location will the consumer be most inclined to play a video, read a text message or view an in-app ad? Smartphone ad geo-fencing enables marketers to reach an audience when they are most receptive to your brand, product, or service marketing.
Think about a consumer’s mindshare when entering an airport. In the traveler waiting for a flight, you have a captive audience thinking about various aspects of their business or leisure travel. Do they need accommodations, transportation, dinner reservations, or other concierge-type services? Smartphone ad geo-fencing can feed location-based ads to travelers once they enter an airport at a time when they are primed to take action.
Virtual Reality
Yeah, yeah, you’ve been hearing about virtual reality headsets for years. But VR is primed for mainstream in 2016. Oculus Rift has set an April release, in addition to other planned releases for HTC Vive and Playstation VR, are poised to put VR in the hands of consumers for hundreds – not thousands – of dollars. But the fact is that consumers don’t need to even shell out this kind of cash to experience virtual reality.
My colleague Michael Quint recently blogged about how Bluetext is leveraging Google Cardboard to bring virtual reality to the masses. Today, we are designing a digital briefing center for a client in virtual reality by marrying, in Michael’s words, “our creativity, advanced video capabilities, and cutting-edge app development to help a software company more effectively tell its story.” In this case it’s a b2b company, but we fully expect b2c virtual reality projects to become increasingly commonplace as the year progresses.
IoT
Consumer marketers are not alone in trying to get their hands around the Internet of Things, and how to leverage IoT for digital marketing efforts. In my end-of-year blog post, I looked at the IoT opportunity for digital marketers in 2016, and what it comes down to is that marketers will be able to capture a growing volume of data on consumer behavior and consumption patterns from connected devices and sensors, and then engage with consumers more effectively based on this data.
Marketing Automation
In a Forrester report, “2015: The Year of the Big Digital Shift,” more than half of marketers admitted their digital marketing is more tactical than strategic. Digital marketers are a victim of their own excess: Forrester reported that investments in marketing technology grew 3.4 percent in 2014 and is projected to rise another 4 percent this year. So consumer marketers will not lack for tools and options, but 2016 is the year when CMOs and their teams must invest time to identify the optimal set of tools to catapult their initiatives. They also most move beyond an understanding of the ‘basic’ capabilities of marketing automation tools, and shift from students to experts fully versed in the in’s and out’s of marketing automation.
In the digital age, digital marketers, companies, and thought leaders are constantly introducing new ideas making it almost impossible to keep up. Lingo overload can leave you:
- Out of touch with the latest digital marketing jargon
- Feeling left out of the marketing conversation.
- Paranoid that your boss will catch on.
That’s why Bluetext has put together a complete guide to Digital Marketing Cybersecurity Lingo!
Bluetext, an award winning integrated digital marketing agency, has created a Digital Marketing Lingo e-Book to ensure you’re up to speed on digital marketing’s latest and greatest.
Click here to download our e-book and sharpen your cybersecurity lingo!
Sometimes it seems as if marketers are speaking their own language when you try to engage them in a Virtual Reality project to support your marketing, branding, or communications goals. From HMD to FOV to Judder, Virtual Reality jargon can be confusing. Whether a Google Cardboard project for your campaign or a high-end Oculus Rift project for a special event, it requires a solid collection of new terminology specific to VR technology. To help demystify some of the most commonly used Virtual Reality terminology so you can have a savvy discussion with your in-house engineers, agency folks or freelance consultants, we’ve put together this VR glossary.

What’s a year-end blog without trends for the next? At Bluetext, we want to make sure our clients are armed with the latest digital marketing best practices so they can continue to compete at the highest level in an increasingly digital environment – here are a handful to keep top of mind as you map out your strategy for 2016:
- Content is King
Developing a steady cadence of quality content that maps to your customers’ buyer journey remains priority tactic number one to build brand awareness, perception, engagement, trust and ultimately conversion. Aside from being the tool du jour for establishing and maintaining market leadership – content marketing is an equally powerful driver of SEO – and a significantly less expensive demand generation mechanism than traditional paid and/or earned outbound marketing that, if done right; will provide you with greater ROI and overall marketing effectiveness. And Instead of disrupting a user’s daily activity to convince them to buy a product or service when 70% of their buying decision has already been made, you’re establishing digital brand authority well in advance of their need to do so.
- Visual Storytelling
Google’s most recent algorithms have placed a premium on visual content over keyword optimization. Search engines use SERP (search engine results page) rankings to measure how valuable your website content is to your users. By prioritizing images, infographics, video and other visual content over plain, less engaging keyword dense text, you are more likely to deliver the quality and relevancy of content to your customers who will then be inclined to spend more time on your website versus your competitors’ to complete their search
- Mobile First
This is the year mobile domination – within the next twelve months mobile will surpass desktop browsing and never look back. That – combined with Google’s latest algorithm putting much more weight on the availability and accessibility of mobile content – have rendered responsive, mobile optimized websites not just essential for growth – but vital to the long term survival of any modern business enterprise.
And this isn’t just about millennials, every demographic is becoming increasingly tethered to their mobile devices as those devices become a more integral part of their daily routines. Strong mobile functionality is so critical that a growing percentage of users won’t even do business with a company without a viable mobile digital presence.
- IOT Marketing
As my Partner Brian Lustig mentioned in his blog last week, user adoption of wearable technology is expected to reach 30% over the next twelve months, providing marketers with more data and even greater insights into our everyday lives that can and will enable them to target people based on their daily habits. As such, we should expect to see the first advertising native to wearable devices in 2016. For marketers this hyper connected world means that your data will have to become more behavior-driven, allowing you to predict your customers every move and target them in real time – and with near perfect accuracy- as users make their way through their individual buying cycles.
- Snapchat
Continuing on the real time theme, Snapchat is quickly looking to become marketers’ new shiny toy for 2016 as they move away from the one size fits all approach and attempt to leverage consumers’ voracious appetite for exclusive, unique and expirable content. And with over 20 million snaps being shared daily across the world, businesses are now taking advantage of Snapchat to promote their brands through real time social engagement marketing. In this increasingly inpatient world, communicating messages that are shorter and more direct have a better opportunity to drive conversion than their older, longwinded brethren.
At Bluetext, we understand that marketers need to adopt real time digital strategies and be more nimble than ever to get the attention of our customers. John Maynard Keynes summation of this challenge is more relevant to today’s modern enterprise than they were nearly a century ago…
“The difficulty lies not so much in developing new ideas as in escaping from old ones…“
And his insights could have no greater application today than they do with marketing.
Lets chat about your 2016 plans and how Bluetext can help you achieve your goals.
Are you feeling out of touch with the latest cybersecurity marketing jargon and worried that your boss might catch on? In the digital age, cybersecurity marketers, companies and thought leaders are constantly introducing new ideas, solutions and technologies that can be impossible to keep up with. From the top down, companies need to be familiar with critical concepts like Sandboxing, Phishing, Patching and Malware, not only so they can keep up with the evolving conversation, but so they can adapt to protect themselves and their customers from cyber threats and breaches. To ensure you’re up to speed with latest and greatest in the world of cybersecurity marketing, we’ve put together a comprehensive Cybersecurity Lingo glossary. Don’t get left out of the conversation.

Do you have the feeling you’re falling out of touch with the latest technology marketing jargon and worried that your co-workers and bosses might catch on? In today’s ever-changing digital marketing industry, professional marketers, companies and thought leaders are constantly introducing new ideas, concepts and technologies, changing the way companies approach digital marketing. Effective web design is becoming increasingly crucial and concepts such as Adaptive vs. Responsive Response, CSS, AJAX and Javascript are becoming more critical to understand. To ensure you’re up to speed with latest and greatest in the world of technology marketing, we’ve created a Technology Marketing Lingo glossary. Make sure you’re not left out of the conversation.

The team here at Bluetext will wind 2015 down with significantly more Internet of Things (IoT) domain expertise than when the year began. Several clients are playing a key role in shaping the future of this nascent technology – one that is sure to touch more consumers, businesses and government agencies in 2016.
Digital marketers are typically not “Naughty by Nature,” but given that Gartner projects a 30 percent increase in the number of connected “things” next year, it is a safe bet that we will be down with IoT. A study conducted by 2nd Watch earlier this year found nearly six in 10 U.S. IT and business executives leveraged IoT/machine data for digital marketing, though the majority (two-thirds) acknowledged these efforts were in the initial stages.
While the Internet of Things presents a massive opportunity, tapping into it won’t be easy. Marketers, already struggling to stay afloat amidst a sea of data, will find that the exploding number of IoT sensors has them drowning in it. Sure enough, data volume is no longer the problem; it’s being able to analyze data and extract meaningful insights from it that will drive successful marketing and advertising campaigns. Capturing and analyzing this data will place an even greater premium on having the right digital marketing tools to automate as much of this process as possible.
As agencies and brands gain a handle on the data volume, look for the Internet of Things to unlock several new digital marketing opportunities in 2016.
- Use IoT for marketing to user behavior patterns – Smart home technologies such as connected thermostats and smart fridges offer marketers an opportunity to reach consumers at the right time and with the right message. Thermostats and home energy management mobile apps empower marketers to tap into a wealth of data regarding energy consumption patterns and activity patterns within the home in a way that can trigger marketing efforts around products (HVAC, filters, windows, roofing, etc.). Or consider the sensor data pushed to brands from smart fridges able to recognize the products you buy and supply levels in a way that can feed discounts and coupons at the opportune time and impact brand purchasing decisions in the process.
- Use IoT to own the buyer journey – The ability to reach target audiences more frequently and with greater personalization throughout the awareness, consideration and decision stages of the buyer’s journey positions IoT to augment traditional touch points such as offline and online advertising, social media, mobile, email, etc. For B2C, smart TVs offer brands a captive audience that can be marketed to before they conduct a product search via Google or in person at the store. For B2B, the ability for technology vendors to understand when printers need to be replaced or cartridges refilled, when warehouse suppliers are running or when businesses are not using energy efficiently can accelerate the buyer journey.
- Use IoT to pull and push data – At this point in its evolutionary cycle, the great value of IoT is that digital marketers can access real-time information on how business users and consumers use products, when they use them, and what motivates them to do so. 2016 will see the early stages of the digital marketer use case shift from pulling all this data to then using analytics to push information back.
- Track where wearables are headed – Try saying that five times really fast. Wearables may be among the most hyped aspects of the Internet of Things, and the market trajectory remains uncertain. The Apple Watch sparked a great deal of imagination pre-launch, and as 2015 comes to a close the technology giant – and its customers – are still feeling their way on how these devices can best be used. Internet connected wearables are poised to extend far beyond just watches; from clothing and shoes to augmented reality devices there exists an opportunity for brands and agencies to reach audiences beyond smartphones and tablets.
- Cars may be ground zero for IoT – Americans drive more than 29 miles per day, making two trips at an average duration of 46 minutes. Those really depressing figures come courtesy of a 2015 study by the AAA Foundation for Traffic Safety and the Urban Institute. For commuters, these numbers are tough to swallow; but for digital marketers identifying the best places to reach target audiences, they are numbers that cannot be ignored. Vehicles are more connected than ever through software systems, and as the vehicle becomes just another data collecting sensor on the move, advertisers and marketers gain valuable insights into when and where people go. The in-vehicle ads become more targeted and valuable, and brands can literally change the course of vehicle destinations based on consumer data.
To learn more about the possibilities IoT offers, contact Bluetext today: