In the digital age, digital marketers, companies, and thought leaders are constantly introducing new ideas making it almost impossible to keep up. Lingo overload can leave you:
- Out of touch with the latest digital marketing jargon
- Feeling left out of the marketing conversation.
- Paranoid that your boss will catch on.
That’s why Bluetext has put together a complete guide to Digital Marketing Lingo!
Bluetext, an award winning integrated digital marketing agency, has created a Digital Marketing Lingo e-Book to ensure you’re up to speed on digital marketing’s latest and greatest.
Click here to download our Digital Marketing Lingo e-Book!
In the competitive global markets, what makes your brand different from your competitors?
Sometimes it takes market research to identify what makes you unique and what’s really important to your target customers. Fill out the form to download Bluetext’s Market Research Primer so you can understand how to:
- Leverage research to craft a market message
- Develop a positioning strategy
- Stand out from the crowd
Click here to download the Market Research Primer today!
Spider Chart, Spider Chart,
Visualizes whatever a spider can
Spins a chart, any size,
Catches insights just like flies
Look Out!
Here comes the Spider Chart
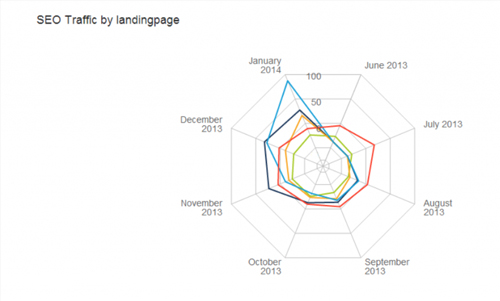
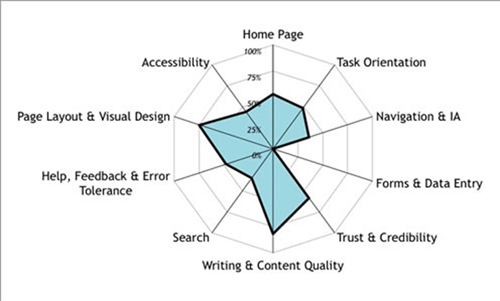
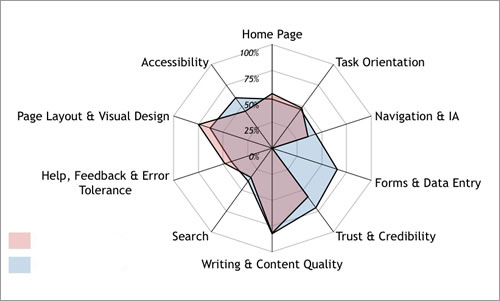
A spider chart plots the values of each category along a separate axis that starts in the center of the chart and ends on the outer ring. These charts are great ways of visualizing the strengths and weaknesses of your current or future state website user experience. At Bluetext we have a deep focus on the science of user experience. After all, when you design and build sites for Fortune 500 companies, every fraction of a percent counts.
Bluetext likes to help visualize the various states of our analysis in spider graphs.
Competitive Analysis Visualization Through Spider Graphs
In today’s fast moving digital marketing world it’s critical to be a watchful eye for our clients to ensure they have a competitive advantage. A real time pulse and visualization of where they fall in the competitive marketplace can be very valuable. The below sample spidergraph can show a marketing leader where they stack in many categories. They can review these sequentially chronologically to see how they are progressing and ensure they have the best opportunity to capture and convert users across their desired journeys to achieve the key performance indicators the site is measured against.
SEO and Landing Page Optimization Visualization Through Spider Graphs
If you really want to impress during a presentation, this is the chart for you. It allows you to display multivariate data easily while also impressing with the visual appeal of its radar shape. Check out the chart above which shows SEO traffic by landing page. This Spider Chart stylishly displays SEO traffic for each series of pages in a specific time frame. This kind chart allows you to easily see real SEO traffic rather than just keyword ranking reports like those from Google Analytics. At the end of the day, the quality and amount of traffic matters more than just keyword ranking. translations The Spider Chart can be used to hold the attention of your audience as you explain the insights you’ve discovered in a way which won’t scare them off.

These charts are just the tip of the data visualization iceberg. Talk to us at Bluetext about your story, brand, or data visualization needs.
Brand Strategy. Brand Presentation. Brand Delivery. Bluetext.
The non-profit world is a crowded space, with fierce competitors all vying for the same members. Make sure your lead gen program is working as hard as your competitors’.
Let Bluetext do a free assessment of your lead generation content to make sure you are getting the best results.
Topics can include:
- Overall Marketing/Branding
- Target Audience
- Lead Generation Strategy
- Media Strategy
- Search Engine Optimization
- Social Media/ Blogging
- Website/Landing Page Conversion Optimization
- Content Strategy
- Lead Nurturing Strategy
- Analytics/ Website Management
To enhance your results, sign up for our Non-Profit Lead Generation Assessment here!
In the crowded and highly-competitive technology market, how do you differentiate your brand from your competitors?
While you’re thinking about how to stand out from the crowd, download a poster from our Adult Coloring Book that you can bring to life, and let Bluetext solve your bigger marketing challenges.
Click here to download our free Adult Coloring Book!
Real estate is a crowded space, with fierce competitors all vying for the same clients. Make sure your lead gen program is working as hard as your competitors’.
Let Bluetext do a free assessment of your lead generation content to make sure you are getting the best results.
Topics can include:
- Overall Marketing/Branding
- Target Audience
- Lead Generation Strategy
- Media Strategy
- Search Engine Optimization
- Social Media/ Blogging
- Website/Landing Page Conversion Optimization
- Content Strategy
- Lead Nurturing Strategy
- Analytics/ Website Management
Sign up for your FREE Lead Generation Assessment here!
PR is not a sinking ship. It’s still an essential element in your marketing mix, especially in the crowded technology market. But is your PR program delivering the results you need to meet your revenue goals?
Let Bluetext do a free PR assessment to see if:
- Your outreach is delivering the results you need
- You are gaining ground in the market
- You’re getting the coverage that will drive your growth
Our Share of Voice assessment can let you know if you are hitting on all cylinders, or if your program needs a shot of high-test to get it in gear.
Sign up for the Technology PR Assessment here!
PR is not a sinking ship. It’s still an essential element in your marketing mix, especially in the crowded non-profit world. But is your PR program delivering the results you need to meet your membership and revenue goals?
Let Bluetext do a free PR assessment to see if:
- Your outreach is delivering the results you need
- You are gaining ground in the market
- You’re getting the coverage that will drive your growth
Our Share of Voice assessment can let you know if you are hitting on all cylinders, or if your program needs a shot of high-test to get it in gear.
Click here to sign up for a free PR Assessment!
Ok all you Thornton Mellon fanatics, the stats are in and the truth must be told. Some interesting data points I hope you all reflect on as you gear up for going back to school.
DATA POINT NUMBER ONE – DEDICATED TO OUR FAVORITE TEACHER SAM KINISON
The mobile revolution is complete. Smartphones account for more than half of searches in 10 countries—including the U.S. and Japan—according to Google, which didn’t release exact percentages or a full list of countries.
Why this is important?
Is every aspect of your digital infrastructure optimized for mobile?
You shouldn’t just stack your desktop elements. You should think through the human factors of mobile design and what your users truly want in the palm of their hand on first visit. Mobile first should be in the DNA of your marketing organization.
DATA POINT NUMBER TWO: THE TRIPLE LINDY OF DATA POINTS
60% of B2B marketers use web traffic to measure success instead of using sales lead quality or social media sharing.
Why this is important?
Success comes down to the key performance indicator and the analytics that you can generate. It’s much easier to track performance and measure return on investment with reliable website traffic data. Great data gives you a clear picture of an online campaign’s viability, but traffic isn’t your only solution. This stat also shows the immaturity of marketing measurement in the majority of organizations and the need for more in-depth data and analysis. If you can ramp up your content marketing analytics in 2015, you’ll be leaps ahead of your competitors.
DATA POINT NUMBER THREE: EMAIL GETS NO RESPECT
63% of consumers prefer to be contacted by email
A new study by Adobe claims that marketers are failing to engage ‘email addicts.’
While 63% say they prefer to be contacted by email, only 20% favor direct mail, 6% social media, 5% the brand’s mobile app, 4% text message and 2% phone.
Why this is important?
Surprisingly, this shows that email campaigns are favored way above even the second most-preferred form of contact from brands, suggesting that email marketing should still be high on every digital marketer’s agenda.
In the crowded and highly-competitive government market, how do you differentiate your brand from your competitors?
While you’re thinking about how to stand out from the crowd, download a poster from our Adult Coloring Book that you can bring to life, and let Bluetext solve your bigger marketing challenges.
Click here to download our free Adult Coloring Book!


