In the age of big data, where vast amounts of information are generated every second, the ability to effectively communicate insights is more crucial than ever. Data visualization stands at the forefront of this effort, transforming complex data sets into clear, actionable insights. At Bluetext, we understand the power of data visualization in making sense of big data, and we’re here to share how mastering this skill can revolutionize the way organizations interpret and use data. In this blog post, we’ll delve into the importance of data visualization, key principles for creating effective visualizations, and the future trends shaping this field.
The Importance of Data Visualization
Data visualization is not just about making data look appealing; it’s about making data comprehensible. Here’s why it’s indispensable in the age of big data:
- Simplifying Complexity: Big data is often complex and unwieldy. Data visualization breaks down this complexity, allowing stakeholders to grasp intricate data sets quickly and accurately.
- Revealing Patterns and Trends: Visual representations make it easier to identify patterns, trends, and outliers that might be missed in raw data tables. This can lead to more informed decision-making.
- Enhancing Communication: Effective data visualization facilitates better communication across teams. By presenting data in a visual format, insights can be shared more easily with non-technical stakeholders, fostering a data-driven culture.
- Driving Action: Clear visualizations can highlight critical insights that drive strategic actions. When data is presented compellingly, it’s easier to make decisions that are backed by evidence.
Key Principles for Effective Data Visualization
Creating effective data visualizations requires a blend of art and science. Here are key principles to guide the process:
- Know Your Audience: Tailor your visualizations to the needs and knowledge level of your audience. What works for a data scientist might not work for a marketing executive.
- Choose the Right Type of Visualization: Different types of data call for different visualization techniques. Bar charts, line graphs, pie charts, scatter plots, and heat maps each serve specific purposes. Choose the one that best represents your data.
- Simplify and Focus: Avoid clutter by focusing on the most important data points. Use color, size, and layout to draw attention to key insights without overwhelming the viewer.
- Tell a Story: Data visualizations should tell a story. Provide context, highlight important trends, and guide the viewer through the data to ensure that the narrative is clear and compelling.
- Ensure Accuracy: Misleading visualizations can lead to incorrect conclusions. Ensure that your data is accurately represented, and avoid distortions that can mislead your audience.
Tools and Technologies for Data Visualization
The rise of big data has brought with it a plethora of tools and technologies designed to facilitate data visualization. Here are some of the most popular:
- Tableau: Known for its user-friendly interface and powerful analytics capabilities, Tableau is a favorite among data professionals for creating interactive and shareable dashboards.
- Power BI: Microsoft’s Power BI integrates seamlessly with other Microsoft products and offers robust data visualization capabilities, making it ideal for businesses already using the Microsoft ecosystem.
- D3.js: For those with a knack for coding, D3.js is a powerful JavaScript library that allows for the creation of highly customized and interactive data visualizations.
- Looker Studio: This free tool from Google allows users to create interactive reports and dashboards, making it a great choice for organizations looking to leverage Google Analytics data.
- Qlik Sense: Qlik Sense offers powerful data integration and visualization features, making it a strong choice for organizations dealing with diverse data sources.
The Future of Data Visualization
As technology continues to evolve, so too will the field of data visualization. Here are some trends to watch:
- Augmented and Virtual Reality: AR and VR are poised to take data visualization to the next level, allowing users to interact with data in immersive, three-dimensional environments.
- Artificial Intelligence and Machine Learning: AI and ML are increasingly being integrated into data visualization tools, providing more advanced analytics and automated insights.
- Real-Time Data Visualization: With the growth of the Internet of Things (IoT) and other real-time data sources, the ability to visualize data in real-time will become increasingly important.
- Enhanced Interactivity: Future data visualization tools will likely offer even more interactive features, allowing users to explore data in new and innovative ways.
Conclusion
Mastering data visualization is essential for communicating insights effectively in the age of big data. By simplifying complexity, revealing patterns, enhancing communication, and driving action, data visualization empowers organizations to make better decisions and stay ahead in a data-driven world. At Bluetext, we are committed to helping businesses harness the power of data visualization to unlock the full potential of their data.
If you’re ready to elevate your data visualization capabilities and communicate your insights more effectively, contact us at Bluetext. Together, we can transform your data into a powerful tool for strategic success.
Every brand is a story, and marketing is your one chance to tell it. Storytelling has always been a successful way to connect brands with their audience because it creates an experience that people want to buy into. But the unfortunate truth is most adults don’t have much availability or attention for storytime like we once did as children. Competition for consumer attention has grown with the seemingly endless information and content that bombards us daily. The solution? Cut to the chase, SparkNotes it if you will. It is most effective to be concise, and engaging, and build a feeling that a consumer can buy into through micro-storytelling.
Micro-storytelling highlights what is truly important and showcases the small ideas that make a brand unique in under 30 seconds. Create a voice for your brand. In a sea of stories, you want to stand out. Catch people’s attention with vibrant colors, and an intriguing tagline, or start your video with a hook that will engage your audience. Make them pause their scrolling and soak in your information. Connect with them so they want to buy into your brand.
With micro-storytelling, the goal is not to fit everything into one video or post but to promote many smaller pieces of content that can easily be consumed at various touch points to tell potential customers what your brand stands for. Audiences want to get through information quickly, especially if they are new customers who are not yet invested in learning more about your brand. Micro-storytelling introduces people to your brand and sparks that initial interest. It’s the perfect teaser to either engage with your brand or share your information with others. It also gives new customers a way to quickly learn more about you, by encouraging them to visit your website or follow your social media accounts.
Four Fundamentals to Help You Create Micro-Stories for Your Brand
Know Your Audience
With micro-storytelling being so concise it is important to convey a tone and message that resonates with your target audience. It is essential for brands to target specific audiences and their specific needs, with a specific message. To create a successful micro-story you must research and gather information to better understand your audience and how you can authentically connect with them. Creating a trusted bond with your customers extends beyond a simple transaction, it works to build a community.
Tap into Visuals
While text helps to tell your story, visuals are a powerful way to communicate quickly with your audience. They must be eye-catching and aesthetic, and showcase your brand or products in a way that supports your brand’s story and values.
Cut the Fluff
Think of how the information you are presenting will be received by people quickly scrolling. Keep it simple. Avoid meaningless details that distract from the overall message. Use short and simple words.
Leave Them on a Cliffhanger
Try not to be definitive with your narrative’s ending. For example, when you go to post about an upcoming event or product launch, announce it in a way that teases what is coming soon. Not only does this save space and time, but it leaves your story open for interpretation and gives customers a chance to think about your brand or come back later to find out more.
Three Effective Ways for Your Brand to Promote Micro-Storytelling
Video
One of the most powerful ways to convey your message in an engaging way is through video. Instagram stories, Tik Toks, or other short-form videos provide an opportunity to convey your story in a short time and continue telling it over time. It also gives you an opportunity to tell your story through unspoken visuals. Think of who is representing your brand. What story is being told by their appearance, tone, and body language? Even what they wear can convey something about your brand story.
Social Media Updates
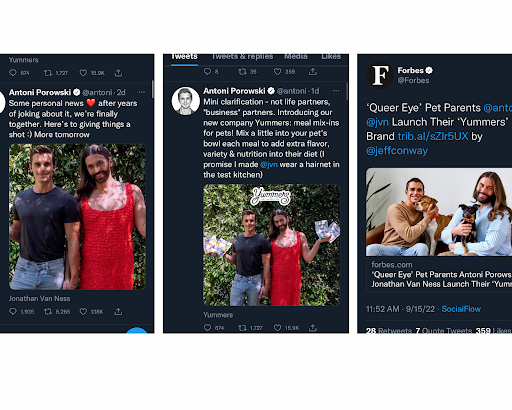
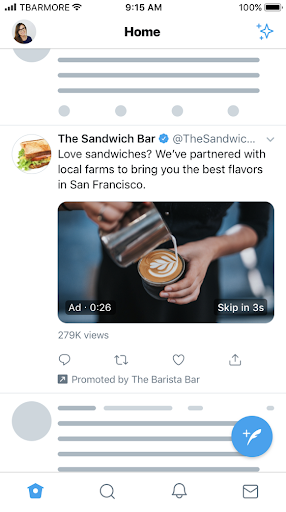
Another compelling way to promote your message is through social media updates. Twitter is a really valuable tool to enforce condensed character counts, which limits brands messaging into more digestible sections. This platform is also adept at piecing content into multiple updates which can be displayed throughout your timeline. This gives users a train of thought to follow the subconscious urge to continue to scroll down and piece together multiple micro-stories.
Infographics
Using infographics to tell your brand’s story creates an effective and digestible way for your consumers to get a lot of information at once. Infographics quickly highlight key takeaways using images and charts. Visuals accompanying text promote higher engagement. With important information involving statistics and facts, infographics help users absorb information with ease.
Micro-stories are just one block of the overarching brand story and when executed correctly, these micro-stories create a powerful message that resonates with consumers.
As a full-service digital marketing agency, Bluetext offers multiple services that can help your brand tailor content to meet customers’ expectations. Connect your stories to your customers. Contact us today to learn more about our messaging and content marketing services.
There’s good news and bad news for companies hoping to make their mark in the cyber security universe. First the good news: The market for these products is huge and growing exponentially. Security Analyst and researcher Richard Stiennon, in a column on Forbes.com and extrapolating from Gartner data, projects a ten-fold increase in IT security spending over the next 10 years- to $639 billion annually by 2023. That’s a number that would have any company executive working overtime to tap into.
But here’s the bad news: This is not exactly a secret. The competition is fierce and growing, as the growing number of solution providers races to meet this demand and take advantage of the opportunity.
It’s easy to have a marketing plan that pushes key messages out to prospective customers. At Bluetext, we think an influencer strategy is essential as part of that plan, and especially in such a crowed space as cyber security.
How any company—from established household names to challenger brands—can break through the noise and the clutter to attract the attention of this market requires an engaging and creative marketing approach that clearly sets it apart and above the competition. This demands a fine understanding of the value it brings to its customers and why it’s the best solution for any particular challenge.
Yet, simply having great creative is only half the battle. Getting that message out to the market is a whole new challenge, and needs both a direct approach and an in-direct strategy—the bank shot to reach the intended audience. Direct tactics are obvious—direct mail, email blasts, online and print advertising, a digital presence, trade shows and webinars; these are all direct appeals to potential customers.
The indirect approach is in many ways more difficult. It requires using industry influencers to reach their larger audiences with your content and messages. That is no small task, and it takes a dedicated investment in time and research. Here are some of the required elements to implement an effective influencer strategy:
1. Identify the best influencers for cyber security.
2. Recruit those influencers as allies and advocates for your thought leadership.
3. Engage those influencers through social media and direct outreach so that they will spread the word to their audiences.
Let’s take these one at a time.
Identify. Identifying the right influencers for any market, and in particular for cyber security, takes some research and digging. The key is finding the leaders who not only have the most followers on social media, but whose content—including tweets, blog posts and news articles—are shared the most frequently. When Bluetext executes an influencer campaign for its clients, we look first at the number of twitter followers and LinkedIn connections for each influencer candidate. But that’s only our starting point. More important is researching their history of shares among that audience. If a particular individual has a large number of followers yet few who share and rebroadcast that content, it could mean that his followers don’t find his content to be valuable, or that he doesn’t post content very often. If there are a lot of shares, retweets and comments, that’s a good indication that the person is read and taken seriously across the industry.
Recruit. Recruiting an influencer doesn’t mean offering them a job. It means building a relationship so that that person knows you are reading his content and pushing it out to your audience. The best way to do this takes work. The first step is to follow that person on Twitter, and to subscribe to his feed if he has a syndication service. The second step requires that the person’s content be reviewed on a daily basis. Any time there is a post that is relevant to your market, share it, follow it, retweet it, comment on it or call it out and add your own perspective. The idea is demonstrate that you are an active fan and follower who is paying attention to the expert.
Engage. Engaging with the influencer is a long-term project. After you have shown interest and built a credible track record of reading and sharing his content, he can be approached as an industry expert, a colleague and a reporter. That might include asking for his opinion on a new development, offering to share an announcement that he might find interesting, and even giving an advance look at a new piece of research or development. The goal is to be viewed the same way that a reporter would view a valuable source—with credibility and interest. When that engagement is solidified, the influencer is much more likely to pay attention to your content and to share it with his audience.
This may seem like a cumbersome process, and Bluetext dedicates a fair amount of energy to make this happen for our clients. But the payoff is significant. Using the bank shot to reach a much broader audience through sources that they trust can help rise above the competition in a crowded and growing market. A smart influencer strategy takes time and commitment, but it’s worth the effort.
If your digital marketing agency team doesn’t have a SMAC roadmap, you may find your company drifting off-course in 2017 and beyond. Here’s brief refresher course on SMAC.
Social Media
Social Media continues to evolve. Platforms rise and fall by the year vs the decades of old. Some new trends we see emerging that we see potentially continuing to gain momentum.
1. Snap’s Evolution Will Result in Interesting New Opportunities.
2. Twitter Fatigue Will Worsen.
3. Users Will Crave More Vicarious Experiences.
4. New Areas of Communication Will Emerge.
Mobile
Mobile devices are the cornerstone of how new business is being built and legacy businesses are reinventing themselves. Mobile devices allow users to constantly update their profile, stay aware of deals and promotions, and track locations and buying habits by virtue of connecting to various wireless signals and near-field communication (NFC) devices.
Some new trends we see emerging that we see potentially continuing to gain momentum.
1. Consumers redefine purchase boundaries; mobile marketing, brand partnerships deepen
2. Department stores, mobile marketing partners tackle the ‘Amazon Effect’
3. Programmatic accelerates: brands, tech, marketing continue to invest
4. Next-generation creative, video redefine mobile engagements
Analytics
As databases have grown larger and processors and memory have become capable of chewing through hundreds of millions of records in a short time, we have begun to see how analytics can do more than just track clicks. Analytics can establish links between entities and make intelligent predictions about customer behavior based on knowledge a system has about a customer — knowledge that has been informed by social networking.
To keep up with the explosion in Big Data, companies and corporations are beginning to invest in BI projects and more and more sophisticated analytics infrastructure. Some new trends we see emerging that we see potentially continuing to gain momentum.
1. Multi-channel Attribution
2. Focus on ‘Return on Analytics Investment
3. Monetization of Data
4. Exciting new players in the MarTech arena to complement the core analytic platforms
Cloud
The cloud element of SMAC refers to the capability a business has to spin up vast amounts of capacity that are paid for by the minute or hour. Businesses do not need to spend millions of dollars building another data warehouse – they simply rent it from a cloud provider, do their work and turn it off. When the business environment changes, they simply spin up another cluster in the cloud, pay another few hundred dollars and continue building insights.
Some new trends we see emerging that we see potentially continuing to gain momentum.
1. Artificial intelligence (AI) will make personalization a reality in 2017.
2. Self-service will be the new normal.
3. Enhancing the Buyer Journey
4. Google Tag Manager and other granular analytics modules being the norm
With buyer sophistication growing daily, marketers need to deliver increasingly smarter strategies and campaigns. Are you taking the time to measure how your efforts are working and think about how you might enhance your efforts, or do you find yourself quickly moving from one campaign to the next?
Need help with your SMAC TALK? Contact the digital marketing gurus at Bluetext.
Attention all you marketers out there…ever sat in a meeting not wanting to raise your hand to ask someone for clarification on what they mean? Concerned that your colleagues or manager will think less of you? Gearing up for your next marketing campaign and need to include some new thinking?
Let’s face it – you are not alone. No one wants to be that person who raises their hand in those situations.
The world of digital marketing is moving very fast with new terms and concepts emerging everyday. From SERP to lead scoring to SEO to responsive design, it is getting harder to keep up.
If you are p
The marketing and communications business is at a bewildering junction, with two simultaneous models vying for brains and assets. Most marketing campaigns look at personas of their buyers and determine what is the best path to the promise land.
Bottom-up marketing is a concept with no single definition, but a few distinct components that set it apart from traditional top-down marketing strategies. Unlike traditional marketing, where executives create a marketing plan and a strategy to promote a company’s products and services, bottom-up marketing is mainly driven by the employees of a company. Employees recognize one specific customer need the company can meet and create a marketing strategy around that single idea.
A great example is Dropbox. Dropbox rose to $10 Billion valuation through its connection with the end user. Dropbox focused on providing the masses of end users (both personal and professional) a block of cloud storage that elegantly and brilliantly stayed synchronized on your local hard drive and your collaborative peers hard drives. Dropbox didn’t sell the CFO on cost benefits and the CTO on the power of the cloud. Dropbox simply delivered a great service with a viral approach to a roll out that created an ever growing desire for more and more storage in the cloud. In the end so many businesses had hundreds and thousands of BYOS (bring your own storage) and they needed to take control of this corporate intellectual property, and reached out to Dropbox for the suite of tools and administration to make managing the cloud instances so much more manageable, secure, and scale-able.
The top-down marketing plan contains four principal sections: situation analysis, marketing objectives, marketing strategy, and tactics. A company’s marketing objectives should be logical deductions from an analysis of its current situation, its prediction of future trends, and its understanding of corporate objectives. In the end, a top down marketing approach focuses on the top executive personas most often. The constituent who controls the purse strings. All SaaS and Enterprise technology companies are always looking for the high and mighty inside an enterprise that has the power to sign on the dotted line. Top down marketing focuses its message and offers so they should relate to the needs of specific target markets and specify sales objectives. Marketing-target objectives should be specific, quantitative, and realistic. The messaging of a top down approach often caters to the fears and dreams of that influential executive.
A great example of top-down marketing is the hyper growth industry of cyber-security. Every executive fears waking up to their employer’s brand on the headlines of major media outlets next to the word breach or hacked. Years and years of customer loyalty and brand preference can be washed away overnight. Cyber security companies are preying on these executives with a top down marketing approach that strikes fear into their hearts and minds and forces them to strike the check and implement countless solutions to help them sleep easy at night as they try to appease key constituencies including public markets.
Does your business ever wonder how to harness its precious marketing and communications budget to achieve its short and long term goals? Contact Bluetext. We are a top marketing agency that delivers results whether your campaign is focused top down or bottom up. Let us use our proprietary methodologies to define the right method, and then develop the campaigns, platforms, and content assets to knock the cover off the ball.

Spider Chart, Spider Chart,
Visualizes whatever a spider can
Spins a chart, any size,
Catches insights just like flies
Look Out!
Here comes the Spider Chart
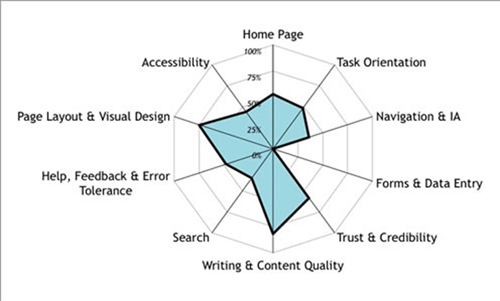
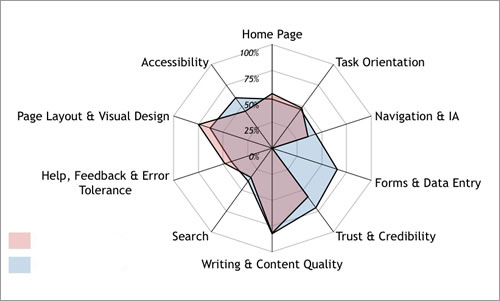
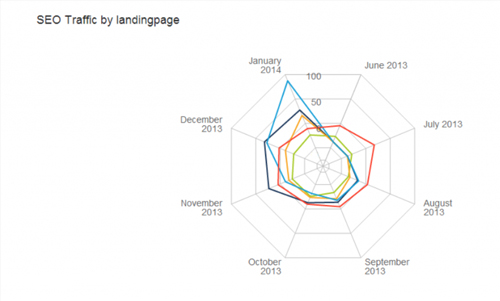
A spider chart plots the values of each category along a separate axis that starts in the center of the chart and ends on the outer ring. These charts are great ways of visualizing the strengths and weaknesses of your current or future state website user experience. At Bluetext we have a deep focus on the science of user experience. After all, when you design and build sites for Fortune 500 companies, every fraction of a percent counts.
Bluetext likes to help visualize the various states of our analysis in spider graphs.
Competitive Analysis Visualization Through Spider Graphs
In today’s fast moving digital marketing world it’s critical to be a watchful eye for our clients to ensure they have a competitive advantage. A real time pulse and visualization of where they fall in the competitive marketplace can be very valuable. The below sample spidergraph can show a marketing leader where they stack in many categories. They can review these sequentially chronologically to see how they are progressing and ensure they have the best opportunity to capture and convert users across their desired journeys to achieve the key performance indicators the site is measured against.
SEO and Landing Page Optimization Visualization Through Spider Graphs
If you really want to impress during a presentation, this is the chart for you. It allows you to display multivariate data easily while also impressing with the visual appeal of its radar shape. Check out the chart above which shows SEO traffic by landing page. This Spider Chart stylishly displays SEO traffic for each series of pages in a specific time frame. This kind chart allows you to easily see real SEO traffic rather than just keyword ranking reports like those from Google Analytics. At the end of the day, the quality and amount of traffic matters more than just keyword ranking. translations The Spider Chart can be used to hold the attention of your audience as you explain the insights you’ve discovered in a way which won’t scare them off.
These charts are just the tip of the data visualization iceberg. Talk to us at Bluetext about your story, brand, or data visualization needs.
Brand Strategy. Brand Presentation. Brand Delivery. Bluetext.
The lowly infographic, once a novelty but more recently a must-have for markets trying to quickly a complicated message, seems to be in the twilight of its existence. What’s more properly referred to as a data visualization used to command the attention and admiration of marketing professionals everywhere. It wasn’t too long ago that such iconic and influential infographics as Aaron Koblin’s map of aircraft flights in the U.S. was dazzling us and pushing everyone towards this engaging new medium.
It’s easy to see why infographics became the darling of the marketing world. People like to be able to visualize complex issues. Our eyes are more comfortable scanning images than wading through data. And with the explosion of big data, making sense of all for that information through text alone can be difficult. We have worked with dozens of clients on ways to visualize and animate their complex data. The truth about infographics is that they are effective when done well, and will continue to be a valuable asset in the marketing toolkit.
Then why do they seem to be falling out of favor? Indeed, according to Sarah Rapp with the portfolio-sharing site Behance, “Infographic posting generally rose steadily from 2007 to 2012, where it peaked, and has begun to decline since then.”
As Fast Company contributor Mark Wilson wrote in a recent blog post, “A few years ago, the Internet was awash in groundbreaking data visualizations…Today, you’d be lucky to find a cheap knockoff in a world dominated by crappy promotional infographics churned out for viral attention.”
There are a few trends that help explain why infographics may seem like they are losing steam. One of the most obvious is the move to mobile, and as any reader of our recent blog post on the latest Google search algorithm change has learned, websites that aren’t mobile friendly are getting dinged in web searches. The reason is obvious—beautiful and intricate graphics typically do not translate to small-screen devices. If smartphones and tablets make up more than half of today’s web traffic, that’s a massive amount of viewers on which a sprawling data visualization would be lost.
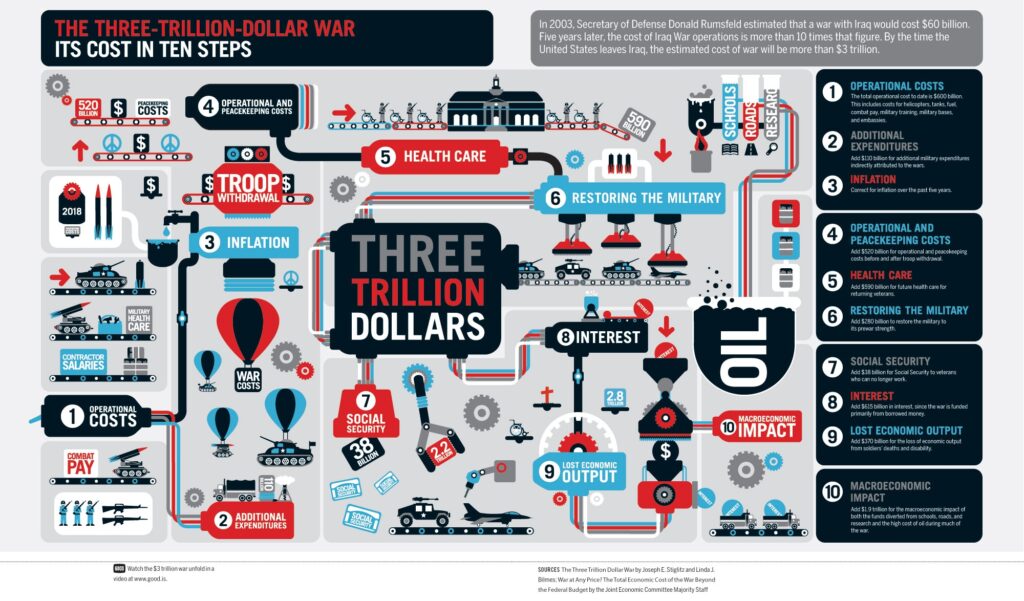
Another is more basic. Many infographics try to pack in so many details and so many data comparisons that they become incomprehensible. Rather than simplifying information, they end up confusing the viewer to the point of their eyes glazing over. Good designs are simple and eye-catching, not complicated and mind-numbing. Here’s an example of data overload:
Finally, as Mark Wilson notes, in many ways infographics have gone mainstream. “Once a playground for independent designers, data visualization has evolved into something more mature, corporate, and honest about its failings,” writes Wilson. “The quirky, experimental infographics that once peppered the Internet may be disappearing. But that’s only because data visualization, as a medium, has finally grown up and gotten a job.”
Bluetext comes at visualization from a different angle. We often work with our clients on what we call “StoryGraphics.” StoryGraphics, as the name suggests, tell a story rather than relying on comparative data to draw comparisons. In many cases, this is because the client may have key messages but not have data that lends itself to clever charts or graphs.
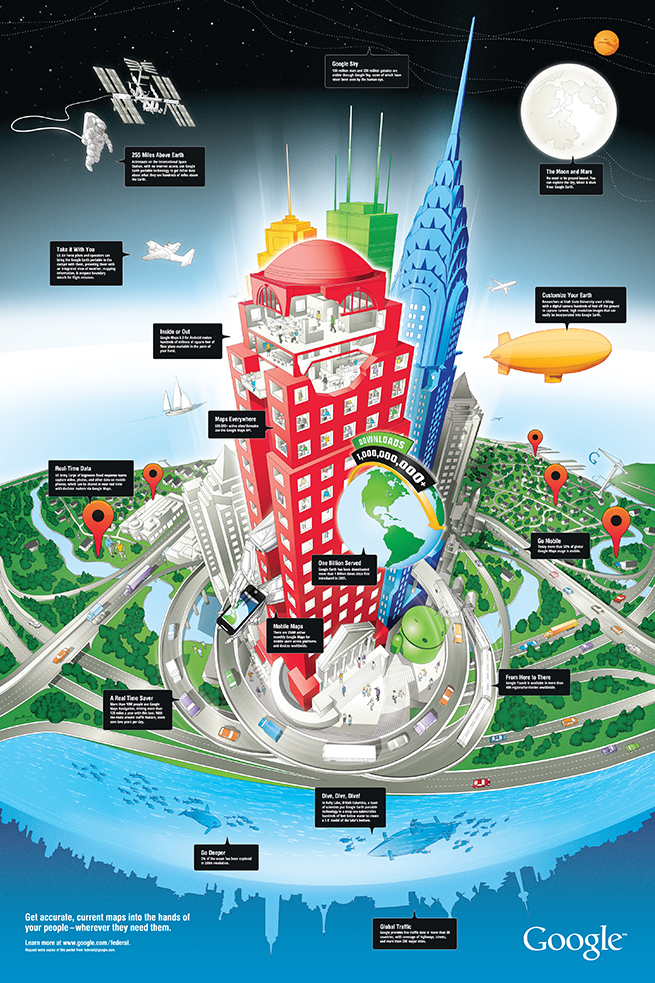
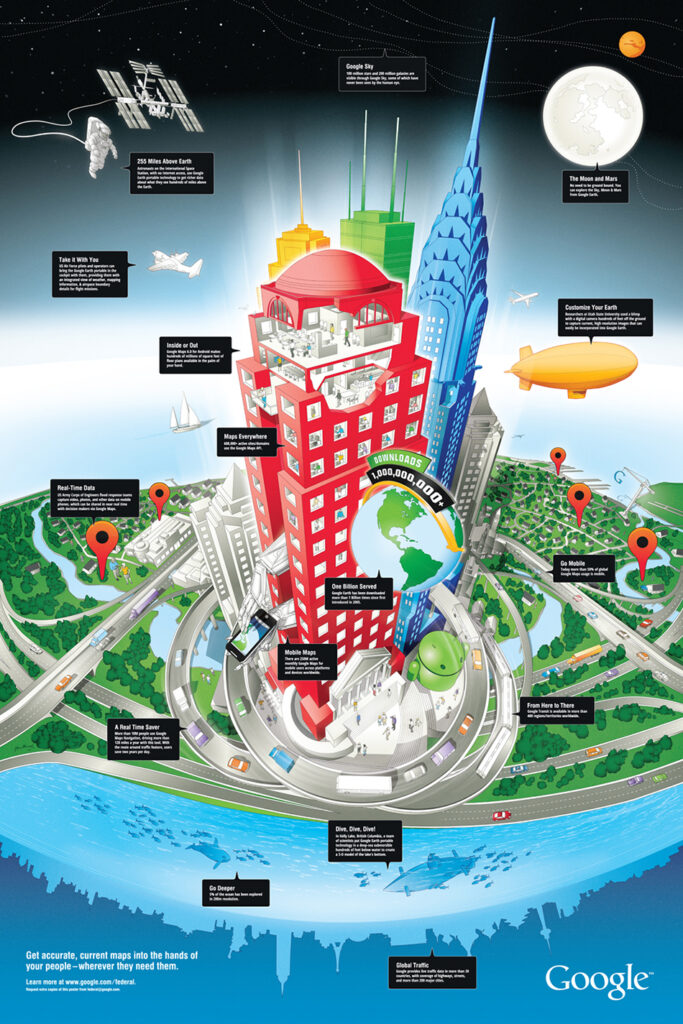
In a design we created for Google recently, the StoryGraphic tells how geospatial information can be used in space, for aviation, at all levels of commerce but also on the water and under the seas. A huge success for the Google enterprise team, this graphic would never have succeeded as a typical infographic.
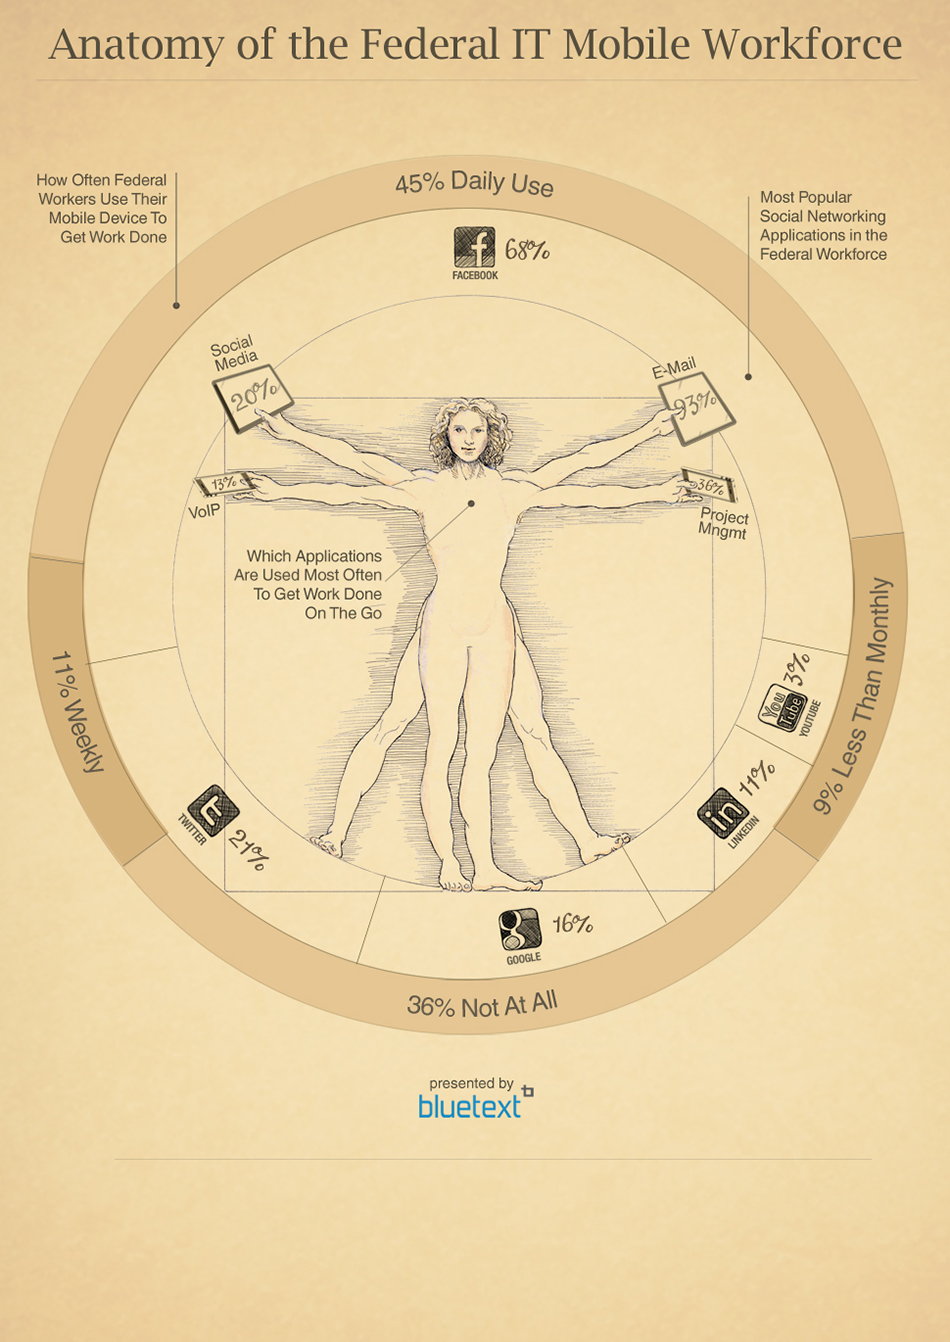
Another Bluetext example shows the move by Federal workers towards mobile devices. While data plays a role in the graphic, it leverages an iconic image to draw the viewer into the story that is being told.
Some of our most compelling client examples do rely on comparative data, but focus on a limited number of statistics to more effectively tell the story. For a design for Georgia Pacific, one of the world’s leading wood products companies, we created a pie chart that took the form of a forest with just one cut down the middle to visualize the difference between government-owned and privately owned forests. The design instantly conveys the surprising fact that there are more private forests than government forests.
You can find compelling and intriguing examples of Bluetext StoryGraphics and infographics here in our portfolio. The bottom line is that marketers can turn to more sophisticated ways of using graphics to tell stories than a confusing jumble of facts and figures.
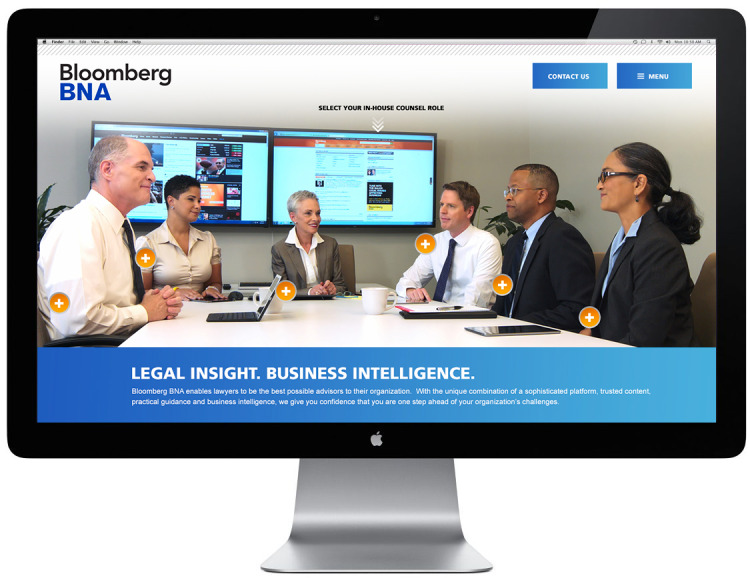
Bloomberg BNA is one of top providers of legal information for attorneys, ranging from court decisions and legal filings to law review articles and news coverage that can affect a company or case. Bloomberg saw a huge opportunity to reach in-house counsel at companies and organizations where litigation, intellectual property, transactions and compliance are managed internally. It needed a dynamic campaign to reach those target attorneys with a good reason why they should add Bloomberg BNA tools to their arsenal.
Bluetext designed a campaign micro-site that begins with a live-action video with six individual personas, representing six use cases, so that target visitors could select the example that most closely matches their own responsibilities. Once the individual is selected, the visitor is taken to a page that provides in-depth details about that particular offering including examples and screen shots.
The site serves as its own segmentation filter, placing targets more directly into the best lead nurture channel. Calls-To-Action are prominent across every page to make it simple to download a whitepaper or infographic, sign up for a relevant newsletter, request a free trial or to learn more. The campaign included a direct mail piece with graphics and designs that match the site.
In the massively competitive real estate industry, companies can gain serious strategic advantage from modernizing their marketing tactics to take advantage of new strategies and tools that are impacting how they communicate with customers and prospects.
Here are five trends we are seeing that could benefit commercial real estate companies as they look to up their marketing game in 2015.
1. Leverage your data
Data provides one of the biggest opportunities to show your strategic differentiation, and in today’s world it can be leveraged in so many visual ways. Buyers leverage it across so many of their key decisions. Embrace it, leverage it, and present it in new and unique ways so that the industry continues to drive toward more visualization…
2. Advertising Goes Digital
Paid digital advertising offers so many more unique and exciting ways to present your business compared to the traditional print methods used for so many years. You can present your assets in so many unique ways, micro target your buyers, and measure the impact to evaluate and evolve your visual message on a constant basis.
3. Social = Snackable
At Bluetext we have been preaching the snackable method for delivering content for a while. Few industries, due to the nature of the services, lend themselves better to this approach. Take your visuals and data and information and present it in bite sized chunks. Be consistent with templates and design for a professional look. Your customers and prospects will take notice.
4. Content. Content. Content
Create great content that can be delivered via reports and webinars, and use it to continuously push your message to your customers and prospects. No one realizes you are expert unless you let them know.
5. Customize Your Campaigns
You know who your targets are. You know what content is important to them. Don’t throw everything on the wall and hope it sticks. With new opportunities to micro target across channels like Twitter, Facebook and LinkedIn to deliver a message to a very targeted audience, now is the time to make sure you are maximizing every opportunity to take the message directly where your prospects are.
Those are just some of the trends that should be considered for 2015. If you are looking for a commercial real estate marketing firm, we are doing a lot of great content marketing for real estate and data visualizations to help marketers differentiate their brand in the competitive commercial real estate arena.
